Ready to build? Describe your app to Appaca
Start for freeHow to Build a Data Visualization Dashboard
Create an interactive data dashboard to visualise KPIs, trends, and metrics from any data source.
Step-by-step guide
6 steps
- 1
Define your KPIs
Identify the 5–10 metrics that matter most to your team or stakeholders. Focus the first version of the dashboard on these rather than trying to show everything.
- 2
Build the dashboard with Appaca
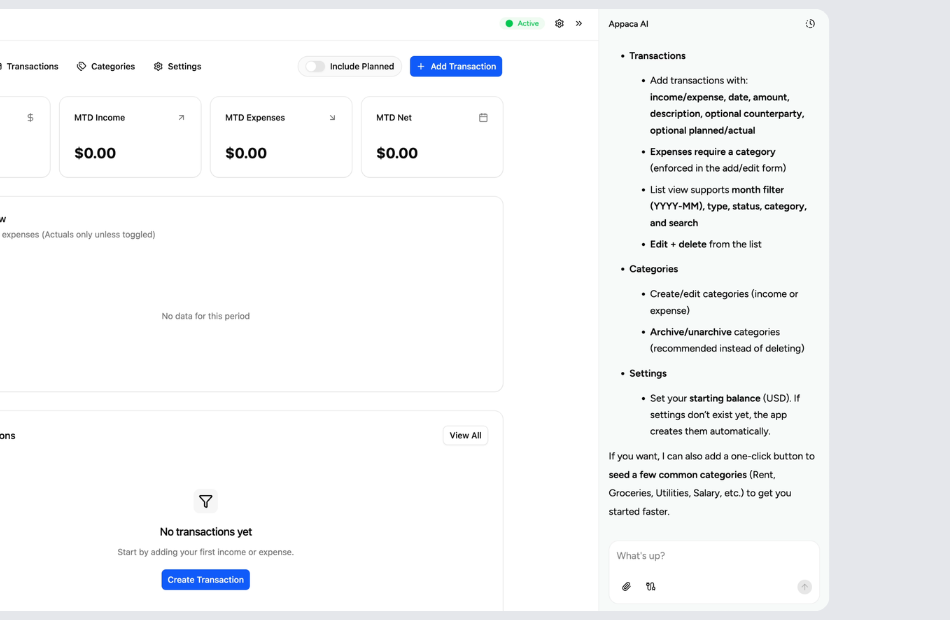
Tell Appaca "Build a data dashboard with summary KPI cards, a trend line chart, a breakdown table, and filters for date range and category." Appaca builds it.
- 3
Import your data
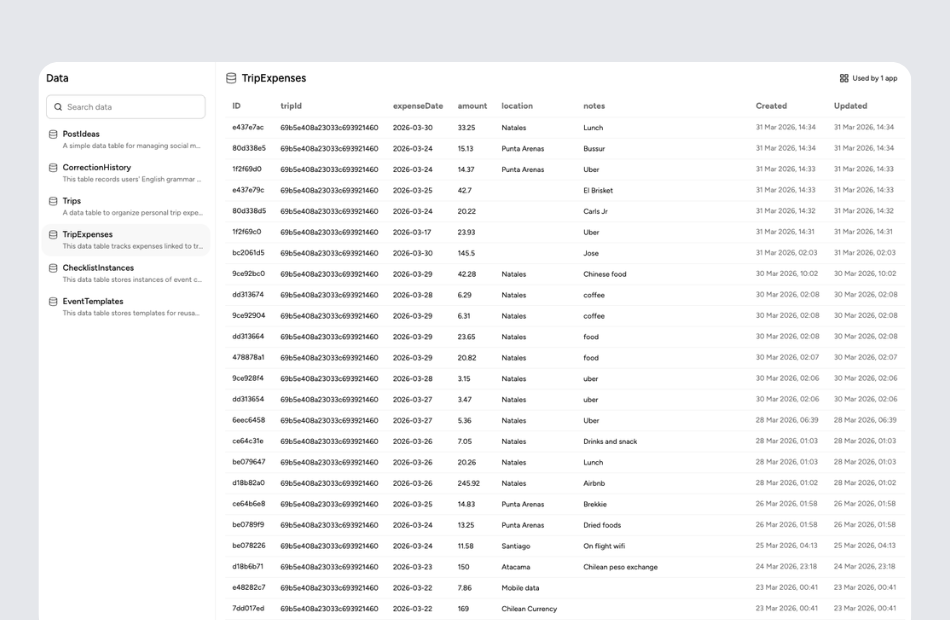
Import existing data via CSV or connect to your Appaca data tables. The dashboard reads from this data in real time.
- 4
Build KPI summary cards
Large, prominent KPI cards at the top of the dashboard give an immediate snapshot: total revenue, active users, conversion rate, and NPS.
- 5
Add trend charts
Line and bar charts show how each metric has changed over time. Include a date range filter so users can adjust the view.
- 6
Add drill-down tables
Below the charts, a sortable table lets users investigate the underlying data. Good dashboards enable both summary and detail.
Ready to build?
Build your a Data Visualization Dashboard now
Describe your app to Appaca and get your first working version in minutes - no coding, no config, no templates.
What Appaca gives you out of the box
Your app comes fully equipped - no hosting, no external database, no extra setup required.
Build and update by chatting with AI
Describe changes in plain language and Appaca applies them instantly. Add new fields, change layouts, build automations - all without touching code.
A real database, built in
Every app you build on Appaca gets its own secure database. Your data stays structured, backed up, and accessible - no spreadsheets or external tools needed.
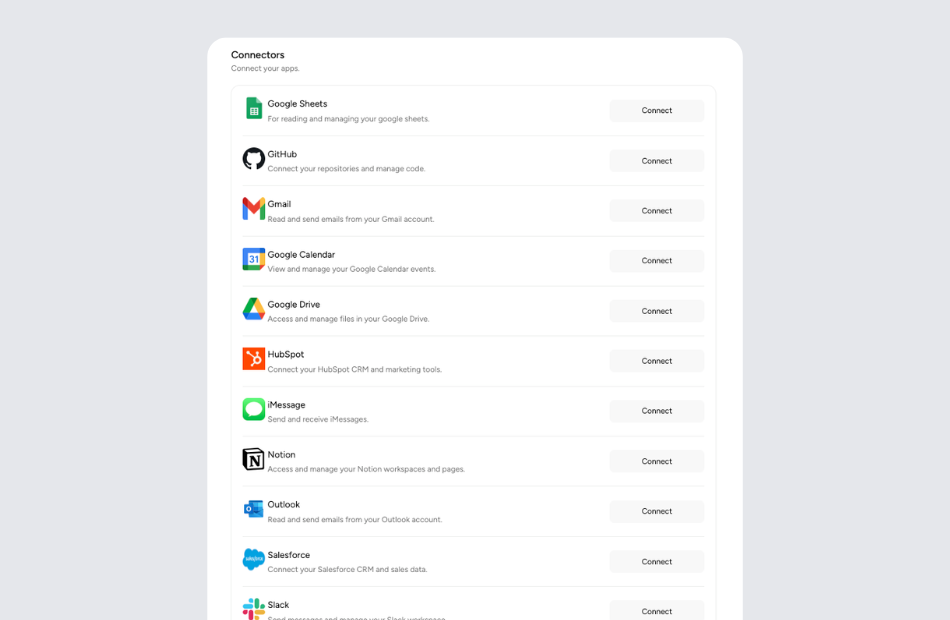
Connect to tools you already use
Link your app to Google Sheets, Slack, Airtable, or any service via API or webhook. Your Appaca app becomes part of your existing workflow.
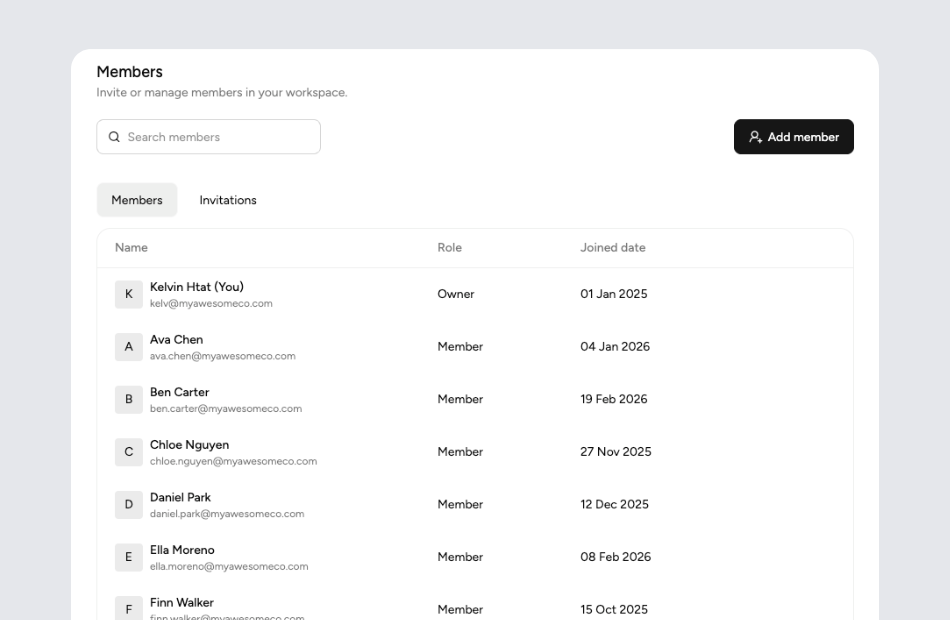
Share with your team instantly
Invite teammates, assign roles, and start using the app together. You control who sees what - individual apps or the whole workspace.
Frequently asked questions
Yes. CSV imports bring external data into Appaca. You can update the data regularly with new exports.
Yes. Share a view-only link with stakeholders who need to see the dashboard without editing anything.
Yes. Date range filters let users adjust the time period shown across all charts and tables simultaneously.
Yes. Appaca dashboards can be embedded via iframe into internal wikis, intranets, or other platforms.
Related guides
How to Build a Sales Dashboard
Create a real-time sales dashboard to track revenue, pipeline, activity, and team performance.
How to Build a Marketing Analytics Dashboard
Create a marketing analytics dashboard to track campaigns, channel performance, leads, and ROI in one place.
How to Build a Manufacturing Dashboard
Create a manufacturing operations dashboard to track production output, quality metrics, downtime, and efficiency.