Create your own ad campaign dashboard
Tell Appaca which ad platforms you run, what metrics matter most, and it creates a campaign dashboard that fits your media buying workflow without juggling separate analytics tabs.
Trusted by incredible people at
What you can make with Appaca
Appaca is a platform for personal software, so your ad campaign dashboard can match your channel mix, KPIs, and reporting cadence instead of a generic analytics template.
Campaign tracking shaped to your channels
Organize campaigns by platform, objective, or funnel stage so every view reflects the way you actually plan and buy media.

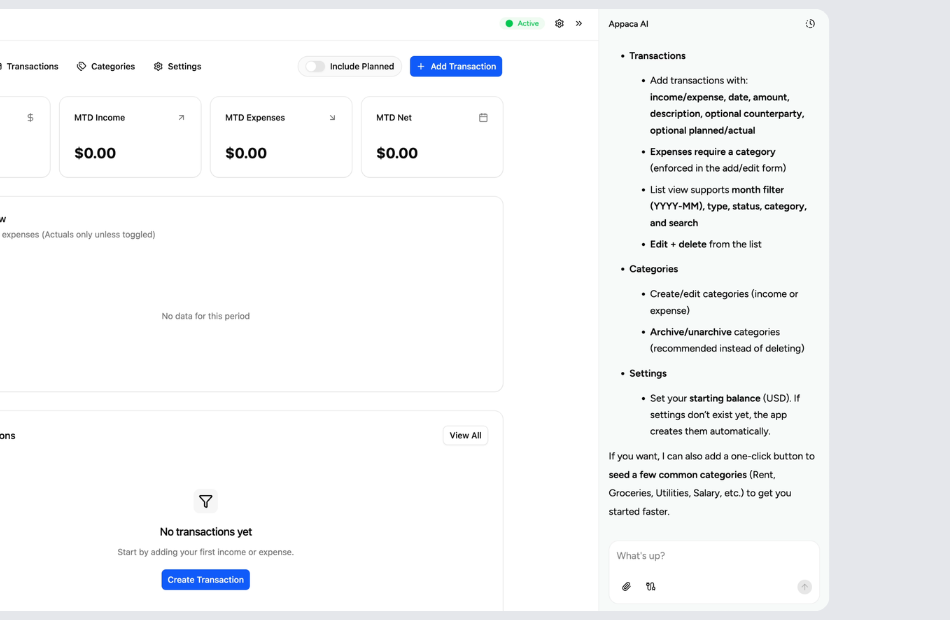
Spend, clicks, and conversions in one place
Bring budget pacing, click-through rates, and ROAS into a single dashboard so you stop flipping between ad manager tabs.

A dashboard you can keep refining
Launch new campaigns or shift budgets and update your dashboard in Appaca without rebuilding reports from scratch.
Personal software for media buyers
Start with the campaigns you run today. Appaca creates the dashboard around your ad accounts, and you can keep refining it as strategies change.
Start with your campaign structure
Tell Appaca which platforms you advertise on, whether you group by objective or audience, and which KPIs you check first each morning.
Let Appaca shape the dashboard around your data
You can describe how spend should roll up, which metrics belong on the overview versus detail views, and how creative performance should display.
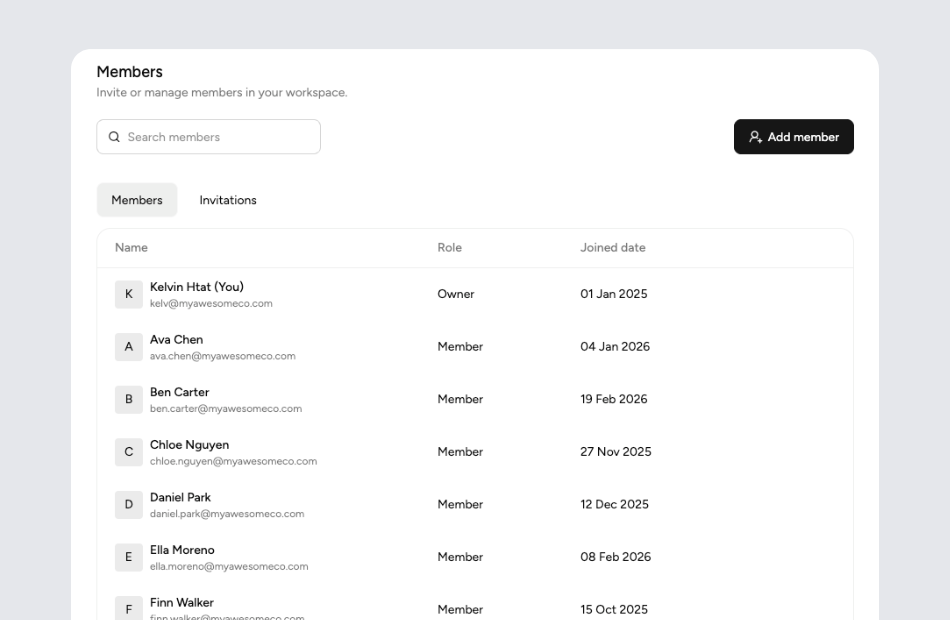
Share it with your team or clients
Invite team members or stakeholders into the same workspace so everyone sees live campaign data without requesting separate reports.
What is an ad campaign dashboard?
An ad campaign dashboard is a centralized view of advertising performance across channels like Google Ads, Meta, TikTok, and LinkedIn. It consolidates spend, impressions, clicks, conversions, and return on ad spend into one interface so marketers can make faster optimization decisions without logging into each platform individually.
Key features to look for in an ad campaign dashboard
Look for cross-channel spend aggregation, real-time budget pacing, ROAS and CPA breakdowns by campaign, and creative-level performance comparisons. The best dashboards also include date-range filtering, custom attribution windows, and the ability to segment data by audience, geography, or funnel stage so you can drill into the metrics that drive decisions.
Why build your own ad campaign dashboard with Appaca
Pre-built dashboards assume a standard set of platforms and KPIs that rarely match your actual media mix. With Appaca, you describe which channels you run, how you structure campaigns, and which metrics matter most, and get a dashboard built around your workflow. As you launch new channels or shift budget allocations, you can refine the dashboard without starting over.
Questions & answers
The most effective approach is a single dashboard that aggregates spend from every platform you use. With Appaca, you describe which ad accounts you manage, and it creates a unified view of spend, impressions, and conversions so you can compare performance without switching between platform dashboards.
Return on ad spend measures revenue generated per dollar spent on advertising. Tracking it at the campaign, ad set, and creative level helps you identify what is working. Appaca lets you build a dashboard that calculates and displays ROAS the way your team defines it, whether blended or channel-specific.
Daily checks catch budget overruns and underperforming creatives early, while weekly reviews help with strategic optimization. Appaca can structure your dashboard with both a daily snapshot view and a weekly summary so each review cadence has the right level of detail.
Yes, comparing ad creatives side by side reveals which headlines, images, or formats drive the best results. Appaca lets you include creative-level metrics like click-through rate and cost per conversion alongside campaign-level data so you can optimize both strategy and execution.
Invite stakeholders into your Appaca workspace so they see live data instead of static exports. You control which views and metrics are visible, keeping the focus on the KPIs that matter to each audience without building separate reports.