Create your own data visualization dashboard
Tell Appaca what data you work with and how you need to see it, and it creates a visual dashboard that fits your analysis workflow without learning complex charting tools.
Trusted by incredible people at
What you can make with Appaca
Appaca is a platform for personal software, so your data visualization dashboard can match your data structure, preferred chart types, and analysis questions instead of a generic charting template.
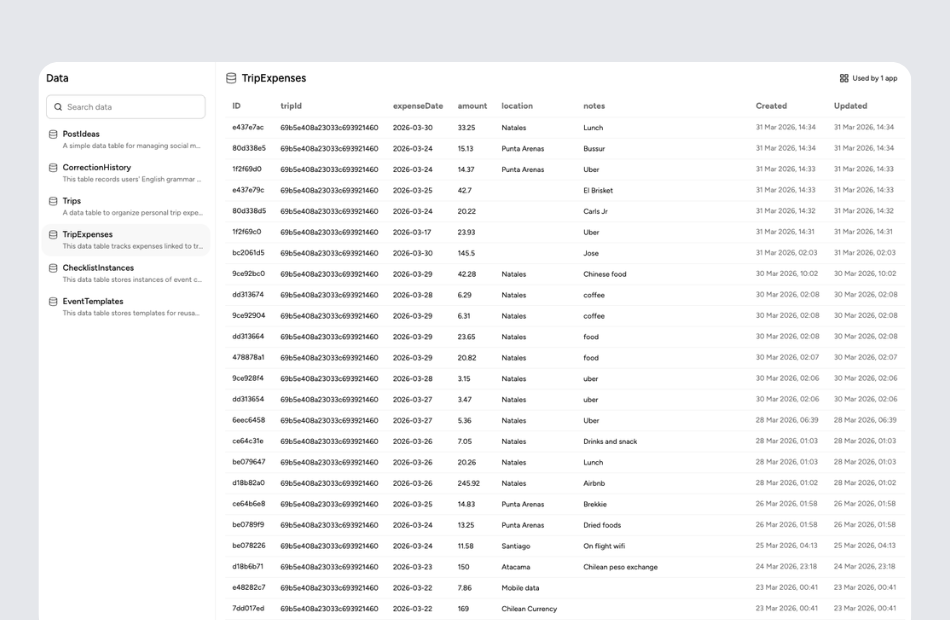
Visualizations shaped to your data
Choose the chart types, groupings, and layouts that make your specific dataset easy to understand and act on.

Charts, tables, and filters working together
Combine bar charts, line graphs, tables, and interactive filters in one dashboard so you can explore data without switching tools.

A visual workspace you can keep improving
Add new datasets, change chart types, or create new views in Appaca as your analysis needs evolve over time.
Personal software for data-driven teams
Start with the questions your data needs to answer. Appaca creates the visualizations around your datasets, and you can keep refining them as new questions emerge.
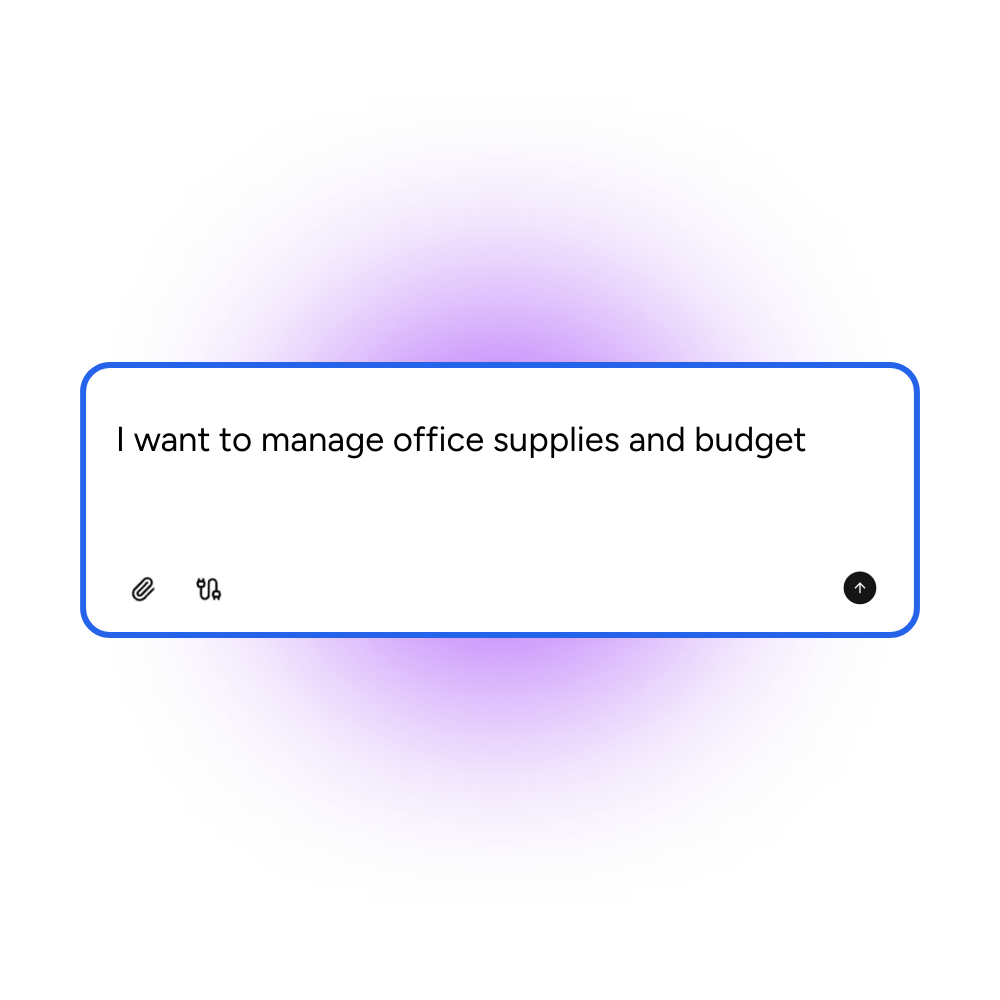
Start with what you need to see
Tell Appaca about your data, the questions you want to answer, and whether you prefer bar charts, line graphs, heatmaps, or tables.
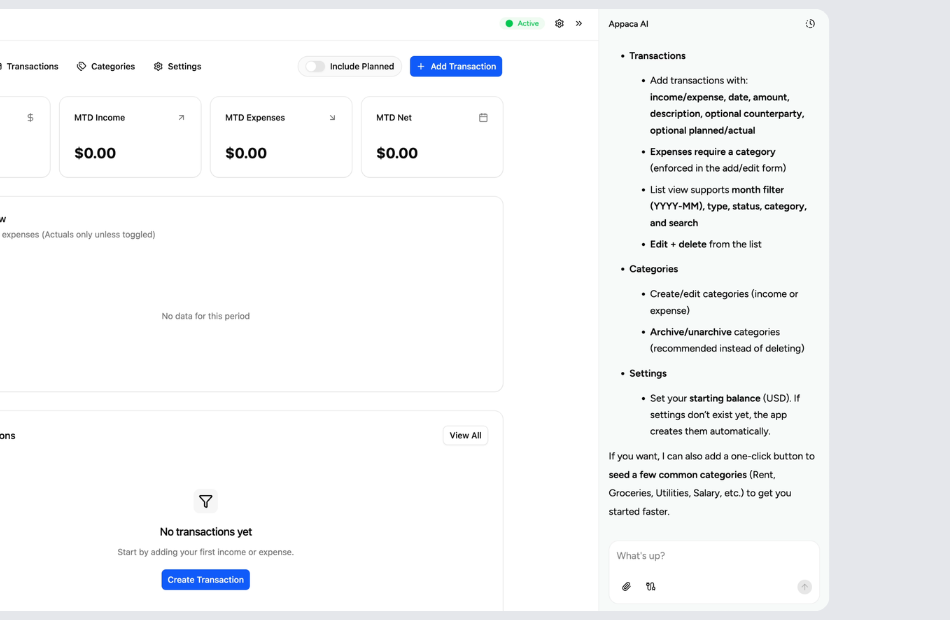
Let Appaca shape the visuals around your dataset
You can describe how data should be grouped, filtered, and compared. Appaca turns that into interactive charts and views you can explore.
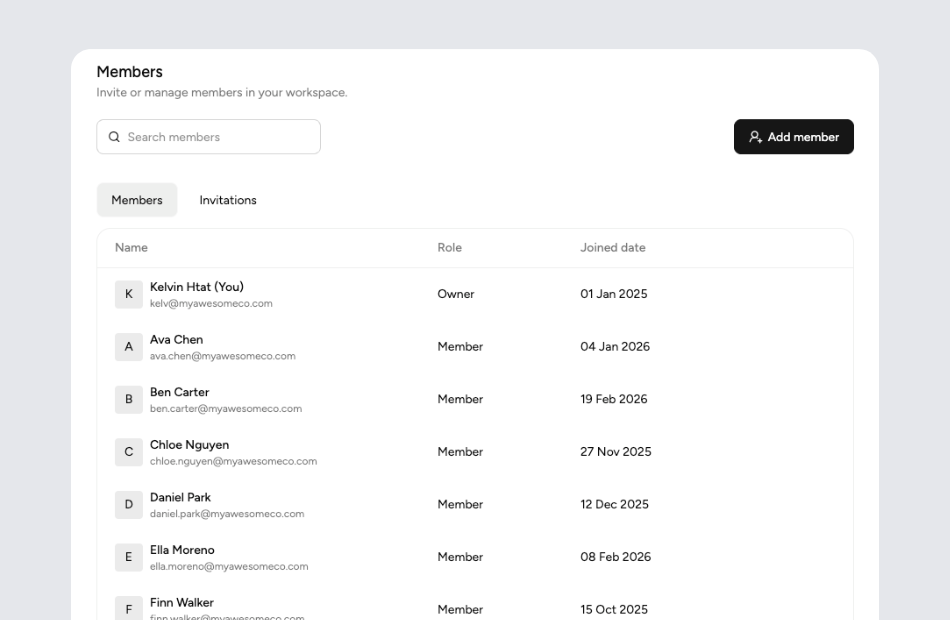
Share visual reports with your team
Invite colleagues into the same workspace so everyone explores the same data and visualizations without emailing static screenshots.
What is a data visualization dashboard?
A data visualization dashboard transforms raw data into charts, graphs, and interactive views that make patterns, trends, and outliers easy to spot. Instead of scanning rows in a spreadsheet, you see your data presented visually so you can identify insights faster and communicate findings clearly to others.
Key features to look for in a data visualization dashboard
Strong visualization dashboards offer a variety of chart types including bar, line, pie, scatter, and heatmap. Interactive filtering, date-range selection, and drill-down capabilities let you explore data at different levels of detail. The ability to combine multiple visualizations on one page and customize layouts ensures the dashboard answers your specific analytical questions.
Why build your own data visualization dashboard with Appaca
Generic charting tools offer hundreds of options but require significant setup to match your data structure. Appaca lets you describe what you want to see, from the chart types to the groupings and filters, and builds a dashboard tailored to your dataset. When your data changes or new questions arise, you can adjust the visualizations without rebuilding from scratch.
Questions & answers
Line charts are ideal for trends over time, bar charts for comparisons between categories, and scatter plots for correlation analysis. The best choice depends on your data and the question you are trying to answer. Appaca lets you describe your data and goals, and it creates the right visualizations for your use case.
Interactive dashboards let users filter, sort, and drill down into data. This means adding date pickers, category filters, and clickable chart elements that reveal more detail. Appaca can build these interactions into your dashboard so exploring data feels intuitive rather than technical.
Yes, combining data from different sources into one view is one of the biggest advantages of a custom dashboard. Appaca lets you describe multiple datasets and how they relate, then creates a unified visual workspace that displays everything together.
The best dashboards update automatically as underlying data changes. With Appaca, your dashboard lives in a workspace where data refreshes and visualizations stay current without manual exports or copy-pasting between tools.
Not with Appaca. You describe what data you have and how you want to see it in plain language. Appaca creates the charts, tables, and interactive elements for you, so you get professional visualizations without writing code or learning a charting library.