Create your own ecommerce analytics dashboard
Tell Appaca what you sell and which numbers drive your store, and it creates an analytics dashboard that fits your ecommerce workflow without cobbling together separate reports.
Trusted by incredible people at
What you can make with Appaca
Appaca is a platform for personal software, so your ecommerce dashboard can match your product catalog, sales channels, and seasonal patterns instead of a generic store report.
Store analytics shaped to your catalog
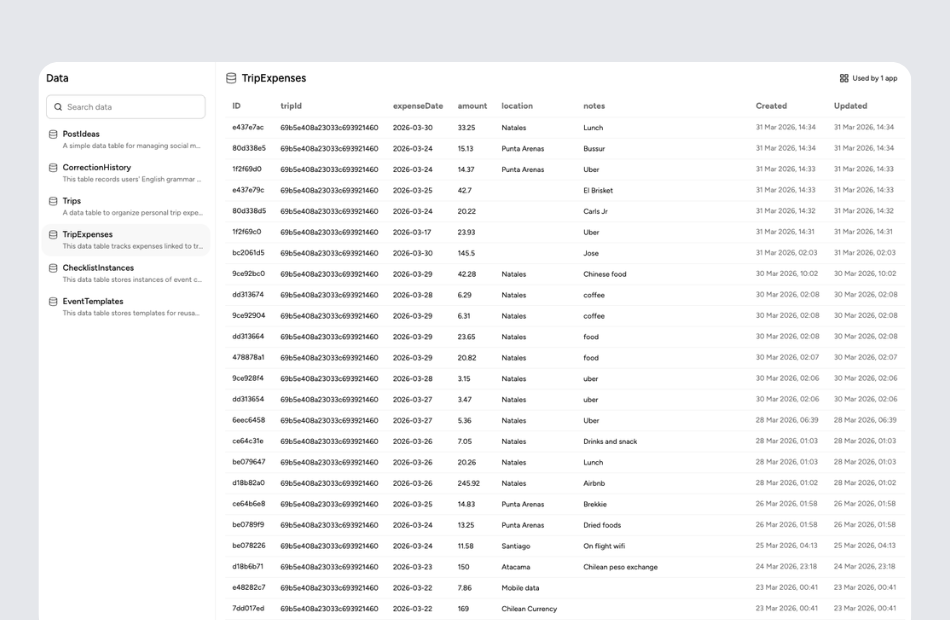
Organize metrics by product category, brand, or sales channel so every view reflects how your ecommerce business actually operates.

Sales, conversions, and inventory together
See revenue trends, conversion rates, and stock levels in one dashboard so you catch opportunities and problems at the same time.

A dashboard that adapts to your growth
Add new products, channels, or metrics and update your dashboard in Appaca without starting from scratch each season.
Personal software for online sellers
Start with the metrics that run your store. Appaca creates the dashboard around your products and channels, and you can keep refining it as your business grows.
Start with what drives your sales
Tell Appaca about your product categories, sales channels, and the KPIs you check every morning like revenue, AOV, and conversion rate.
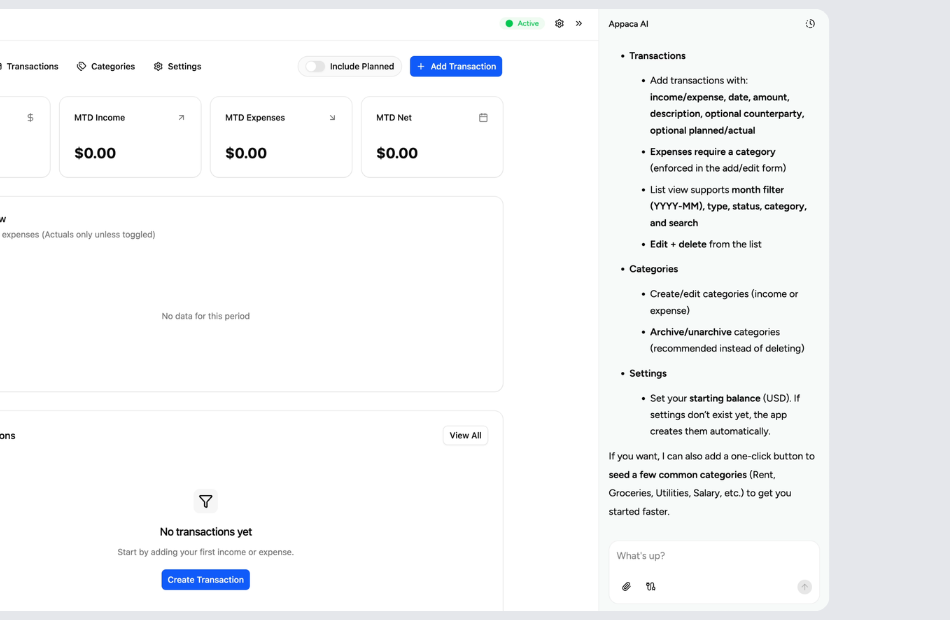
Let Appaca shape the dashboard around your store
You can describe how you want products ranked, which trends to highlight, and what funnel stages matter most. Appaca turns that into software.
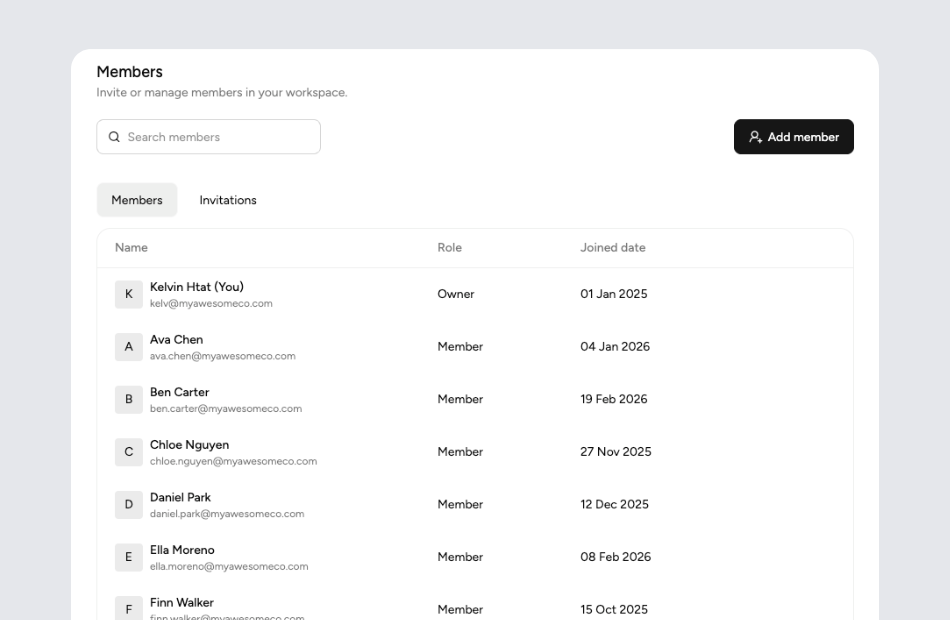
Share insights with your team
Invite marketing, inventory, and fulfillment teams into the same workspace so everyone acts on the same sales data without waiting for weekly reports.
What is an ecommerce analytics dashboard?
An ecommerce analytics dashboard is a centralized view of your online store performance, covering sales revenue, order volume, average order value, conversion rates, and product-level metrics. It helps store owners and marketers understand what is selling, where traffic converts, and which products need attention so they can make data-driven merchandising and marketing decisions.
Key features to look for in an ecommerce analytics dashboard
Look for real-time sales tracking, conversion funnel visualization, product performance rankings, and customer segmentation views. The most useful dashboards also include average order value trends, return rate monitoring, and the ability to filter by date range, product category, or traffic source so you can drill into the metrics that drive profitability.
Why build your own ecommerce analytics dashboard with Appaca
Built-in store analytics are limited and third-party tools often require complex setup. With Appaca, you describe your catalog structure, sales channels, and the questions you want answered, and get a dashboard built around your actual business. As you add products, expand to new channels, or shift your strategy, you can refine the dashboard without switching analytics platforms.
Questions & answers
Revenue, order count, conversion rate, and average order value are the essentials for a daily check. Monitoring these together helps you spot trends early, like a drop in conversions despite steady traffic. Appaca builds a dashboard that puts your daily must-see metrics front and center.
Product performance dashboards rank items by revenue, units sold, or margin and highlight trends over time. Appaca can create product leaderboards with filters for category, date range, and sales channel so you see exactly which products drive your business.
Conversion rates vary by industry, but most online stores see between two and four percent. More important than the benchmark is tracking your own trend over time. Appaca can display conversion rate trends alongside traffic and revenue so you understand how changes in the funnel affect sales.
Customer lifetime value combines average order value, purchase frequency, and retention rate. Tracking it helps you understand how much to invest in acquisition and retention. Appaca lets you include CLV calculations and cohort views in your analytics dashboard alongside day-to-day sales metrics.
Yes, most ecommerce businesses sell through a website, marketplaces, and social channels simultaneously. Appaca lets you build a dashboard that breaks down performance by channel so you can compare revenue, AOV, and conversion rates across every place you sell.