Create your own energy consumption dashboard
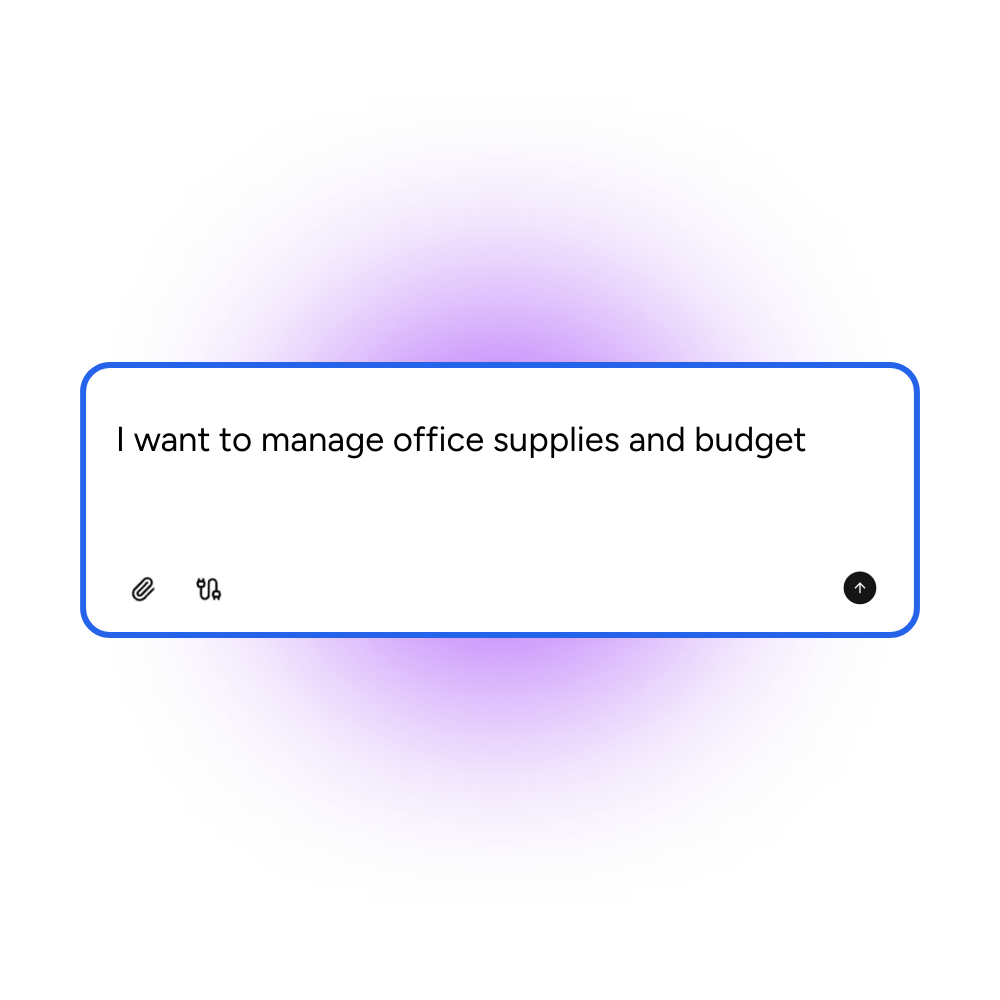
Tell Appaca which utilities you track and what efficiency targets matter, and it creates a consumption dashboard that fits your facilities without navigating complicated energy management platforms.
Trusted by incredible people at
What you can make with Appaca
Appaca is a platform for personal software, so your energy dashboard can match your utility mix, building portfolio, and sustainability goals instead of a generic monitoring template.
Energy tracking shaped to your facilities
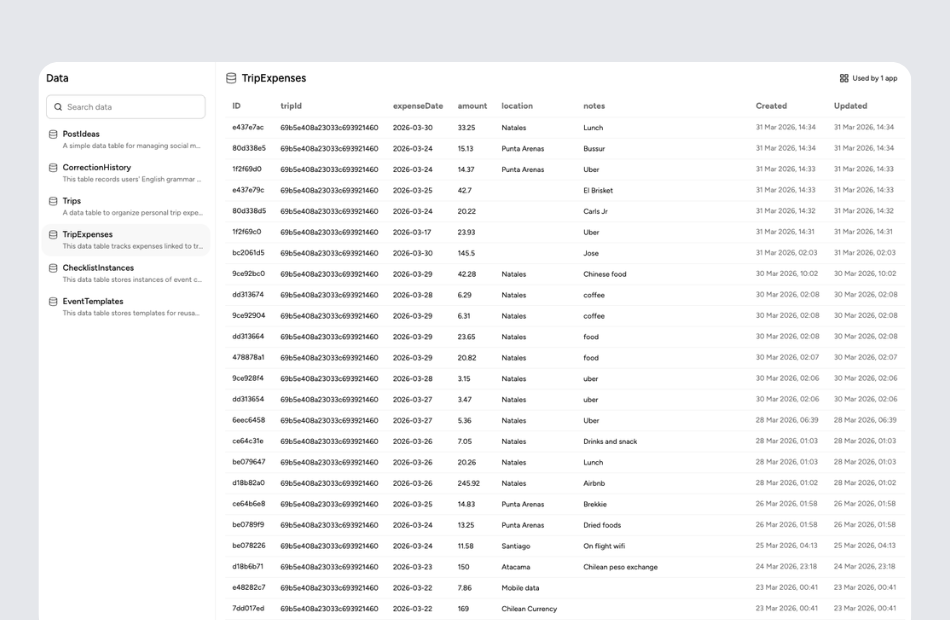
Organize consumption by building, floor, department, or utility type so every view reflects how your organization actually uses energy.

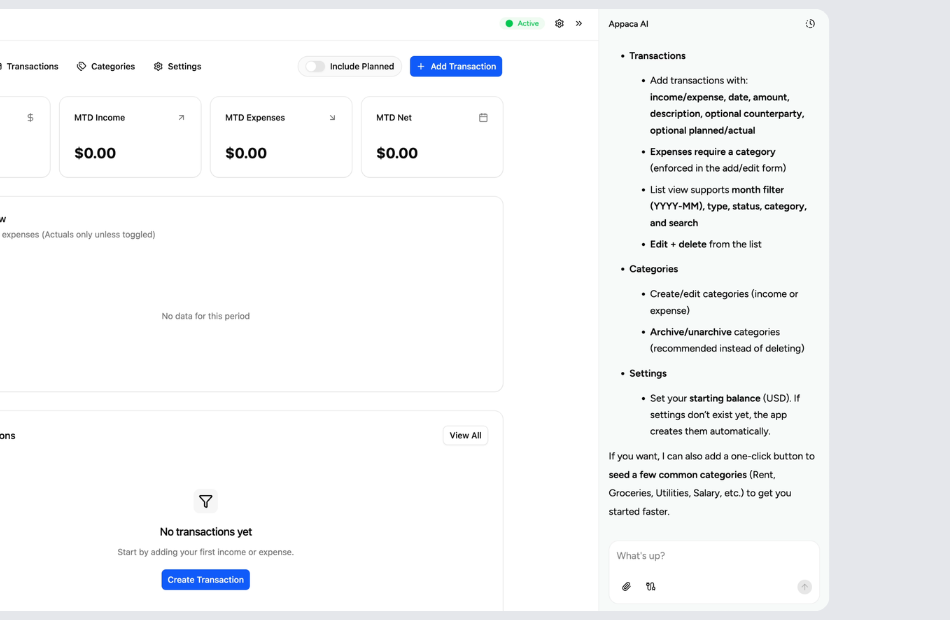
Usage, costs, and targets in one place
See kilowatt-hours, utility bills, and efficiency goals together so you can connect consumption patterns to real dollar amounts.
A dashboard you can update as facilities change
Add new sites, adjust baselines, or track new utility types in Appaca without rebuilding your monitoring setup.
Personal software for facility managers
Start with the utilities and buildings you manage. Appaca creates the dashboard around your energy data, and you can keep refining it as efficiency targets evolve.
Start with your utility data
Tell Appaca which utilities you track, how many sites or buildings you manage, and what consumption patterns you want to monitor.
Let Appaca shape the dashboard around your goals
You can describe your efficiency targets, cost reduction benchmarks, and how you want to compare consumption across time periods or locations.
Share it with operations and sustainability teams
Invite team members into the same workspace so everyone from maintenance to C-suite tracks energy performance from the same source.
What is an energy consumption dashboard?
An energy consumption dashboard tracks electricity, gas, water, and other utility usage across buildings or sites in real time. It helps facility managers and sustainability teams monitor how much energy is being used, where costs are highest, and whether efficiency targets are being met. By consolidating utility data into one view, it replaces spreadsheet-based tracking and makes it easier to spot waste.
Key features to look for in an energy consumption dashboard
Look for multi-utility tracking, cost-per-unit calculations, period-over-period comparisons, and peak demand monitoring. The best dashboards also include savings goal progress, per-building or per-zone breakdowns, and anomaly detection that flags unusual consumption spikes so you can investigate before the next billing cycle.
Why build your own energy consumption dashboard with Appaca
Energy management platforms are often expensive and over-engineered for organizations that just need clear visibility into usage and costs. Appaca lets you describe your facilities, utility mix, and efficiency goals, and builds a dashboard around your actual operations. You can adjust it as you add buildings, change providers, or set new sustainability targets without switching platforms.
Questions & answers
The most effective approach is a single dashboard that breaks down consumption by site so you can compare performance and identify which buildings use the most energy. Appaca lets you describe your building portfolio and creates a dashboard with per-site views, making multi-facility tracking straightforward.
Peak demand is the highest rate of energy consumption during a billing period and often drives a significant portion of utility costs. Monitoring peak usage helps you shift loads or reduce consumption during expensive hours. Appaca can include peak demand tracking and time-of-use views in your dashboard so you spot costly spikes early.
Start with a baseline of current consumption and set percentage-based reduction goals for each building or utility type. Tracking progress monthly reveals whether efficiency measures are working. Appaca lets you define targets and display progress alongside actual usage so your savings goals stay visible and actionable.
Yes, comparing month-over-month or year-over-year consumption and costs is essential for understanding trends and the impact of seasonal changes. Appaca can build period comparison views into your dashboard so you see how consumption shifts over time without manually pulling utility bills.
Anomaly detection flags consumption that deviates from normal patterns, which can indicate equipment malfunctions or operational inefficiencies. Appaca can include threshold-based alerts and visual indicators in your dashboard so unusual spikes are obvious and prompt investigation before they inflate your utility bill.