Create your own IT infrastructure dashboard
Tell Appaca what systems you manage and what health metrics matter, and it creates an infrastructure dashboard that fits your ops workflow without configuring heavy monitoring platforms.
Trusted by incredible people at
What you can make with Appaca
Appaca is a platform for personal software, so your IT dashboard can match your server inventory, service topology, and alerting priorities instead of a generic monitoring setup.
Infrastructure monitoring shaped to your stack
Organize systems by environment, service tier, or location so every view reflects how your IT team actually manages infrastructure.

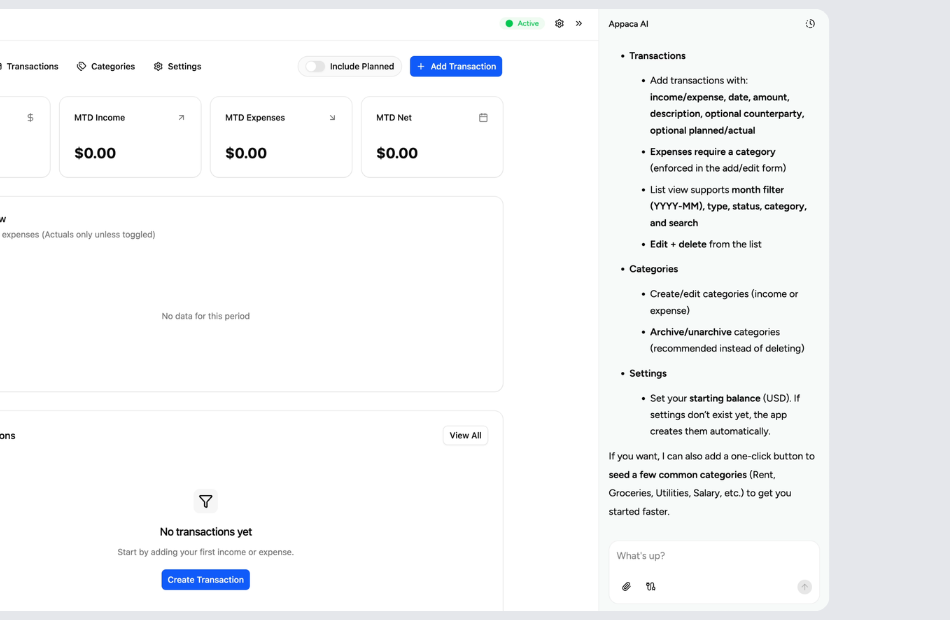
Uptime, incidents, and capacity in one view
See server status, recent incidents, and resource utilization together so you spot problems and plan capacity from the same dashboard.

A dashboard that adapts as infrastructure scales
Add new servers, services, or monitoring criteria in Appaca without reconfiguring your entire observability stack.
Personal software for IT operations
Start with the systems you manage today. Appaca creates the dashboard around your infrastructure, and you can keep refining it as your environment grows.
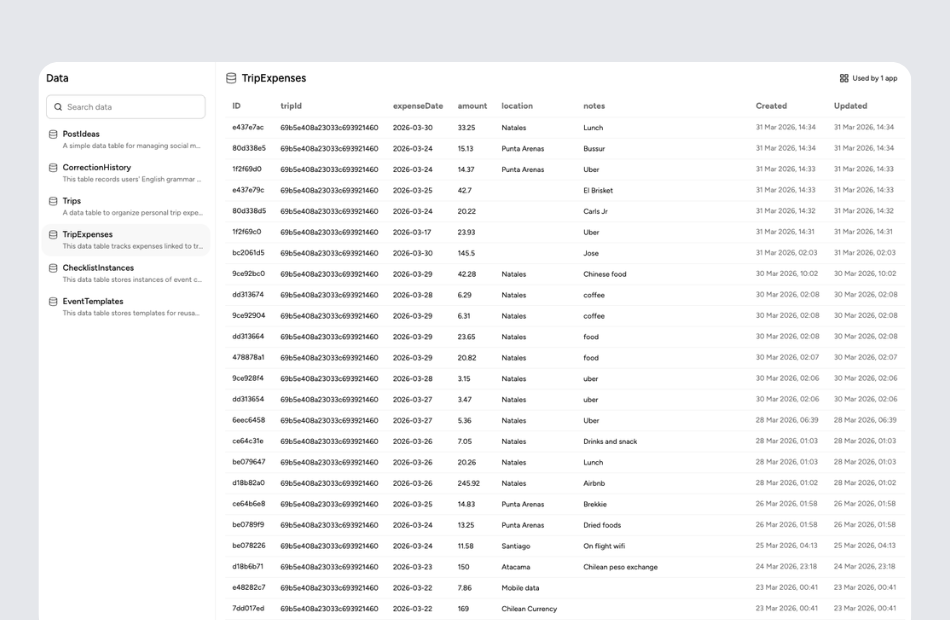
Start with your system inventory
Tell Appaca which servers, services, and network components you manage, and what uptime and performance thresholds you monitor.
Let Appaca shape the dashboard around your priorities
You can describe which systems are most critical, how incidents should be logged, and what capacity trends you need to watch.
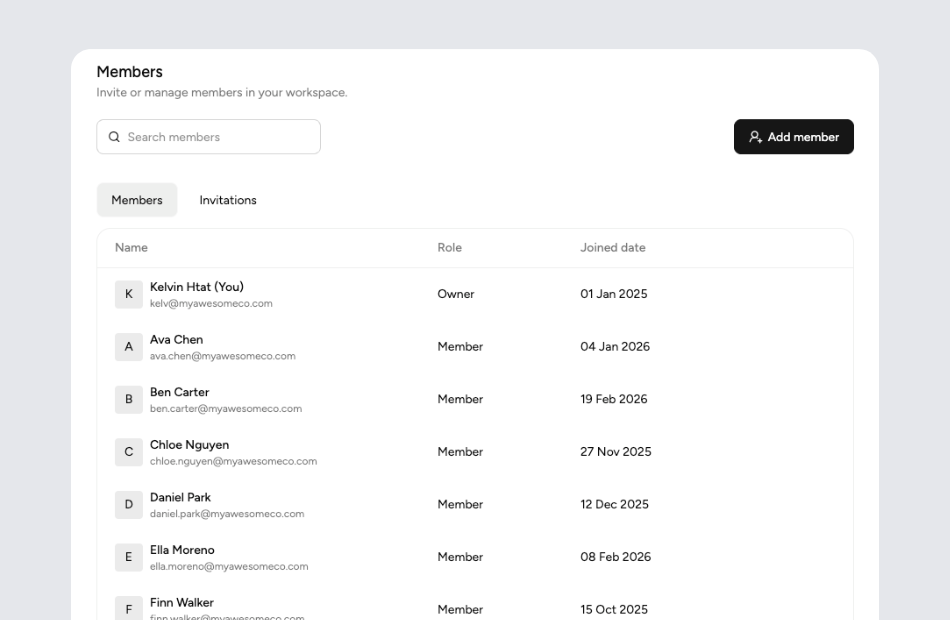
Share it with your IT team
Invite sysadmins, DevOps engineers, and IT managers into the same workspace so everyone has real-time visibility into infrastructure health.
What is an IT infrastructure dashboard?
An IT infrastructure dashboard provides a real-time overview of server health, network performance, service availability, and incident status across your technology environment. It helps IT teams detect issues quickly, track resolution progress, and plan capacity by consolidating monitoring data into a single interface rather than checking individual systems one by one.
Key features to look for in an IT infrastructure dashboard
Effective IT dashboards include server and service status indicators, uptime percentage tracking, incident logs with resolution timelines, and resource utilization charts for CPU, memory, and disk. Look for environment-level views that separate production from staging, alerting threshold configuration, and historical trend data for capacity planning.
Why build your own IT infrastructure dashboard with Appaca
Full-featured monitoring platforms require significant setup and ongoing configuration that smaller IT teams struggle to maintain. Appaca lets you describe your infrastructure, the metrics that matter, and how incidents are managed, and builds a dashboard around your actual operations. As you add servers or adopt new services, you can update the dashboard without overhauling your monitoring tools.
Questions & answers
Effective uptime monitoring requires status checks at regular intervals with clear visual indicators for healthy, degraded, and down states. Appaca lets you build a dashboard with real-time status views for every server you manage, so outages are visible the moment they happen.
A good incident view includes the affected system, severity, time to detection, and resolution status. Tracking mean time to resolution over time helps identify systemic issues. Appaca can build incident logs with these fields and trend views so your team sees both active issues and historical patterns.
Capacity planning requires historical utilization data and trend projections. Tracking CPU, memory, and storage usage over time reveals when you will need to scale. Appaca can include utilization trend charts and growth projections in your dashboard so capacity decisions are data-driven.
Yes, environment-level filtering is essential for IT teams that manage multiple environments. Appaca lets you organize your dashboard by environment so you can focus on production health during incidents while still monitoring staging and development infrastructure.
A simplified status page showing service availability and recent incident summaries communicates infrastructure health without overwhelming non-technical audiences. Appaca lets you create high-level views in the same workspace alongside detailed technical dashboards so each audience sees what they need.