Create your own virtual event analytics dashboard
Tell Appaca how you measure event success, track attendee behavior, and report on ROI, and it creates an analytics dashboard that fits your event program without cobbling together spreadsheets.
Trusted by incredible people at
What you can make with Appaca
Appaca is a platform for personal software, so your event dashboard can match your event format and success criteria instead of a generic webinar report.
Event metrics shaped to your format and goals
Build a dashboard around webinars, conferences, workshops, or hybrid events with the specific attendance, engagement, and conversion metrics that define success for you.

Attendance, engagement, and ROI tracking together
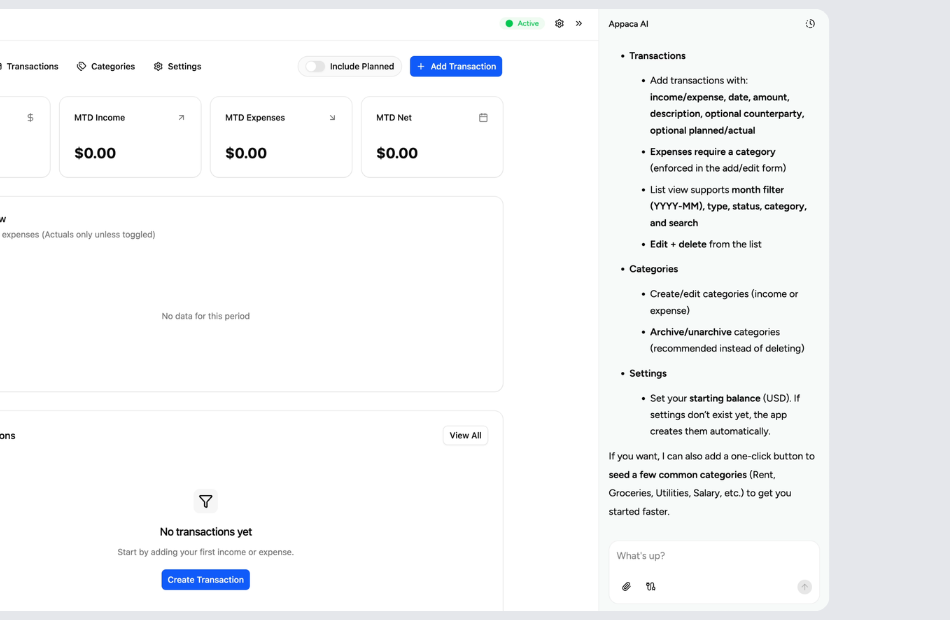
Combine registration numbers, live attendance rates, session-level engagement, poll responses, and post-event conversions in a single view for complete event intelligence.

A dashboard you can keep refining
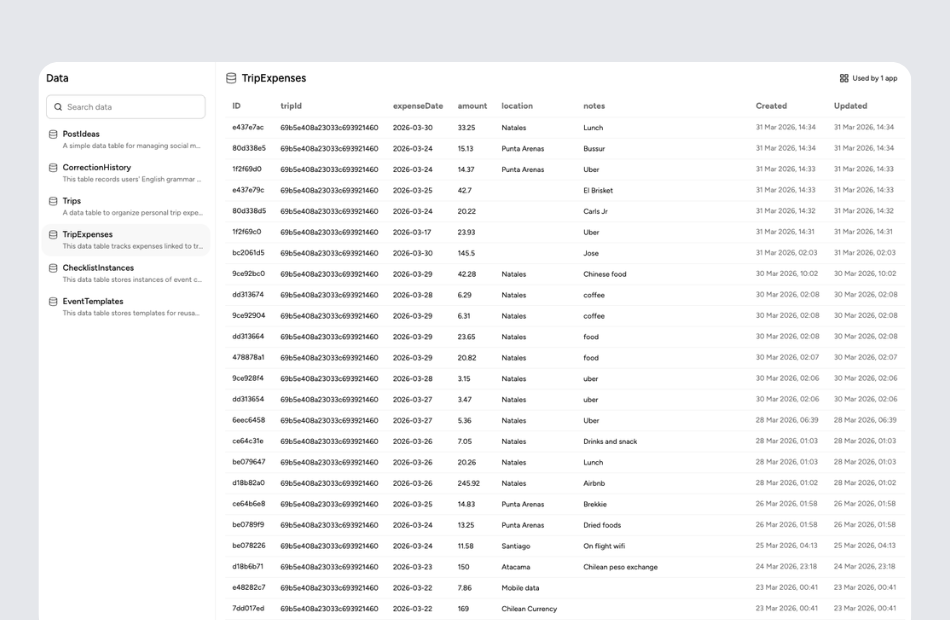
The app lives inside Appaca, so you can analyze your next event and add new metrics, comparisons, or reporting layers as your event program matures.
Personal software for event organizers
Start with how you define event success. Appaca creates a dashboard around your metrics, and you can keep refining it across events.
Start with what success looks like for your events
Tell Appaca whether you measure registrations, attendance rate, session engagement, lead quality, sponsor satisfaction, or a combination - and how you want the data organized.
Let Appaca shape the dashboard around your event program
You can describe your event types, audience segments, and which comparisons matter most across events. Appaca turns that into a dashboard with the right views and breakdowns.
Share it with sponsors and stakeholders
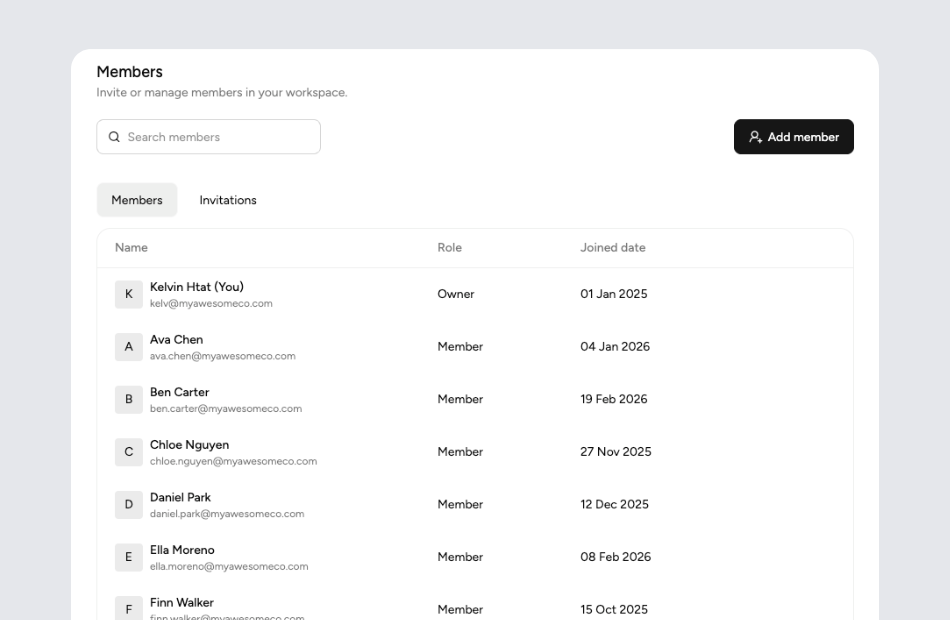
Invite sponsors, executives, or co-organizers into the same workspace so everyone can see event performance and review results without waiting for a post-event report.
What is a virtual event analytics dashboard?
A virtual event analytics dashboard consolidates attendee data, engagement metrics, and post-event outcomes into a single view so organizers can understand what worked and what to improve. Instead of downloading CSV files from your webinar platform and building manual reports, a dashboard gives you real-time and post-event visibility into registration trends, attendance rates, session engagement, and the business impact of your events.
Key features to look for in a virtual event analytics dashboard
Look for registration and attendance tracking that shows drop-off at each stage, session-level engagement metrics like poll participation and chat activity, and post-event analytics that connect attendance to business outcomes like leads or sales. Multi-event comparison helps you see trends across your event calendar. Reporting views that you can share with sponsors or executives round out the essential features.
Why build your own virtual event analytics dashboard with Appaca
Event platforms provide basic analytics, but they rarely match how your organization defines success. With Appaca, you decide which metrics matter - whether that is session-level engagement, sponsor visibility, attendee satisfaction, or pipeline influence - and build a dashboard that tracks exactly those things. You can compare events, segment audiences, and create sponsor-ready reports that go far beyond what any single event platform offers out of the box.
Questions & answers
Start with registration count, attendance rate, and average session duration as your baseline. Then add engagement metrics like poll responses, chat messages, and Q&A participation. For business events, track post-event conversions - meetings booked, leads generated, or deals influenced. Appaca lets you choose the exact metrics for your dashboard.
Define what return means for your events - leads generated, pipeline created, sponsor renewals, or attendee satisfaction scores. Then track those outcomes alongside event costs. With Appaca, you can build an ROI view that connects your event investment to the business results that matter to your stakeholders.
Yes. A multi-event view lets you see how registration rates, attendance, engagement, and outcomes trend over time. This is invaluable for improving your event program from one quarter to the next. Appaca lets you set up side-by-side or trend-based comparisons.
With Appaca, you can invite sponsors into the workspace with a view that shows attendee engagement, brand visibility metrics, and lead data relevant to their sponsorship. This replaces static post-event decks with a live, detailed report.
Absolutely. The dashboard tracks whatever data you feed it, so you can add in-person check-in numbers, badge scan data, or booth visit counts alongside virtual metrics. Appaca lets you design the structure to match your event format.