Create your own weather monitoring dashboard
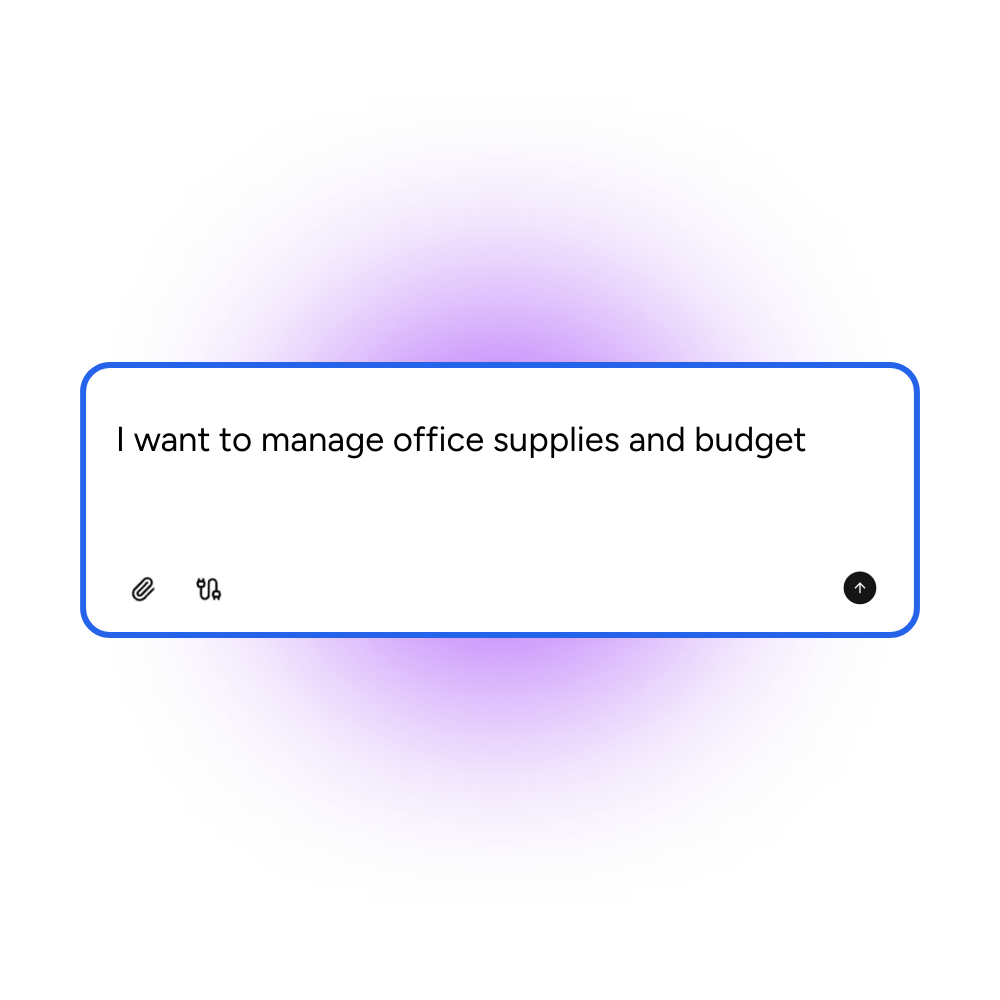
Tell Appaca which locations, conditions, and thresholds matter to you, and it creates a weather dashboard that fits your monitoring needs without a one-size-fits-all forecast widget.
Trusted by incredible people at
What you can make with Appaca
Appaca is a platform for personal software, so your weather dashboard can match your specific locations and operational thresholds instead of a generic forecast app.
Weather tracking shaped to your locations
Build a dashboard around the specific sites, regions, or routes you need to monitor - whether that is farm plots, construction sites, event venues, or supply chain corridors.

Conditions, forecasts, and historical data together
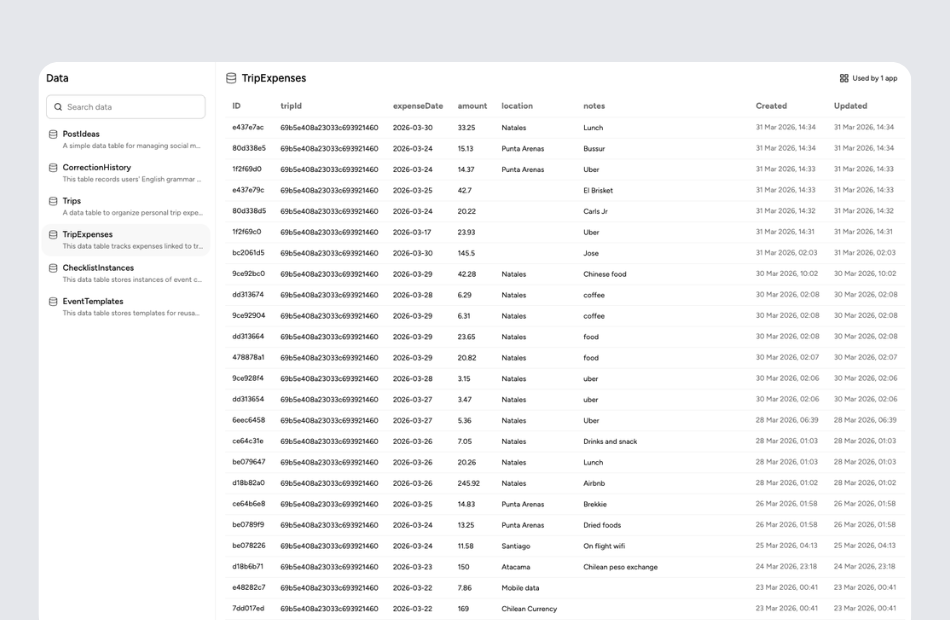
Combine current conditions, multi-day forecasts, historical averages, and alert thresholds in a single view so you can make weather-dependent decisions with full context.
A dashboard you can keep refining
The app lives inside Appaca, so you can start monitoring today and add new locations, metrics, or alert rules as your operations expand.
Personal software for weather-dependent operations
Start with the locations and conditions you care about. Appaca creates a dashboard around your monitoring needs, and you can keep refining it over time.
Start with the locations and conditions you track
Tell Appaca which sites or regions matter, what weather variables to monitor - temperature, precipitation, wind, humidity - and what thresholds trigger concern.
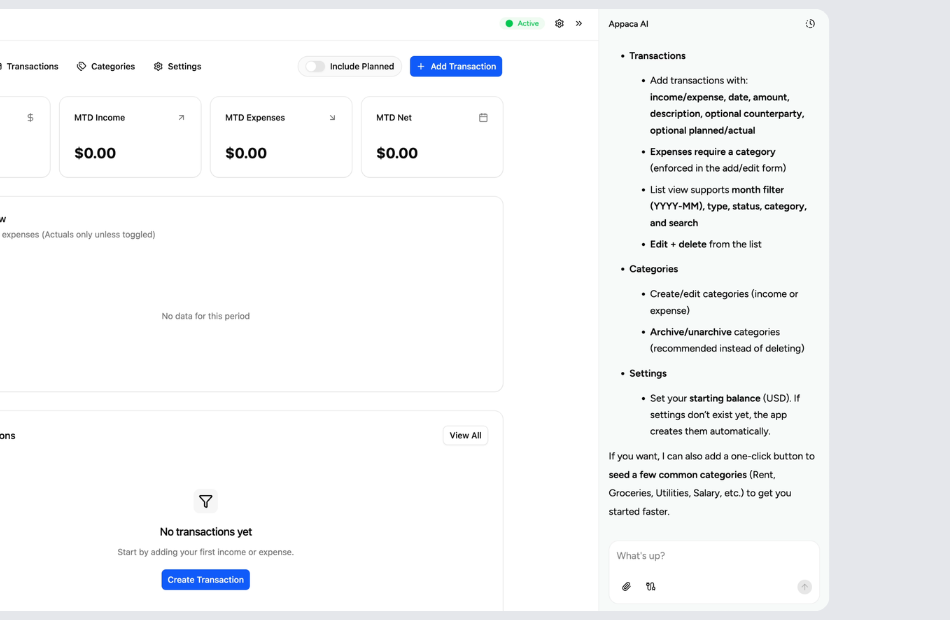
Let Appaca shape the dashboard around your operations
You can describe how weather data should be displayed, which historical comparisons matter, and what alert conditions to flag. Appaca turns that into software.
Share it with your field team
Invite site managers, logistics coordinators, or farming partners into the same workspace so everyone can check conditions and respond to weather changes together.
What is a weather monitoring dashboard?
A weather monitoring dashboard is a centralized tool for tracking weather conditions across one or more locations, combining current readings, forecasts, and historical data in a single view. It is used by farmers, construction managers, event planners, logistics teams, and anyone whose operations depend on weather conditions. Instead of checking multiple forecast apps or scattered sensor readings, a dashboard gives you a focused, location-specific view of the data that affects your decisions.
Key features to look for in a weather monitoring dashboard
An effective weather dashboard supports multi-location monitoring so you can track different sites side by side. Current conditions and short-term forecasts are table stakes. Historical data views help you compare current conditions to past years. Alert thresholds for wind speed, temperature, precipitation, or humidity let you know when conditions cross into concerning territory. Customizable time ranges - hourly, daily, weekly - keep the data at the right granularity for your use case.
Why build your own weather monitoring dashboard with Appaca
Generic weather apps show you the same forecast everyone else sees. With Appaca, you build a dashboard focused on the specific locations, variables, and thresholds that matter to your operations. A farmer tracking frost risk needs different data than a construction manager watching wind speeds. Appaca lets you define what to monitor, how to visualize it, and when to flag a concern - so the dashboard works for your situation, not a general audience.
Questions & answers
It depends on your operations. Farmers often track temperature, precipitation, soil moisture, and frost risk. Construction teams focus on wind speed, precipitation, and lightning alerts. Event planners watch temperature, rain probability, and wind. Appaca lets you choose the exact variables that matter so your dashboard stays focused and useful.
Yes. You can set up your dashboard with a view for each location - whether that is individual farm fields, construction sites, or warehouse regions. Appaca lets you organize locations however makes sense for your operations.
Define the conditions that matter - for example, wind above 40 mph, temperature below freezing, or rainfall above 2 inches - and the dashboard can flag those thresholds visually. Appaca lets you configure the specific alert rules that match your operational risk factors.
Yes. Historical comparison views let you see whether current conditions are unusual relative to past years. This is valuable for agriculture, energy planning, and any industry where seasonal patterns affect operations. Appaca can include historical overlays in your dashboard design.
Absolutely. If you want to track conditions for your garden, plan outdoor activities, or monitor conditions at a vacation property, a personal weather dashboard gives you exactly the data you care about without the clutter of a general forecast app. Appaca makes it easy to build a focused view for any use case.