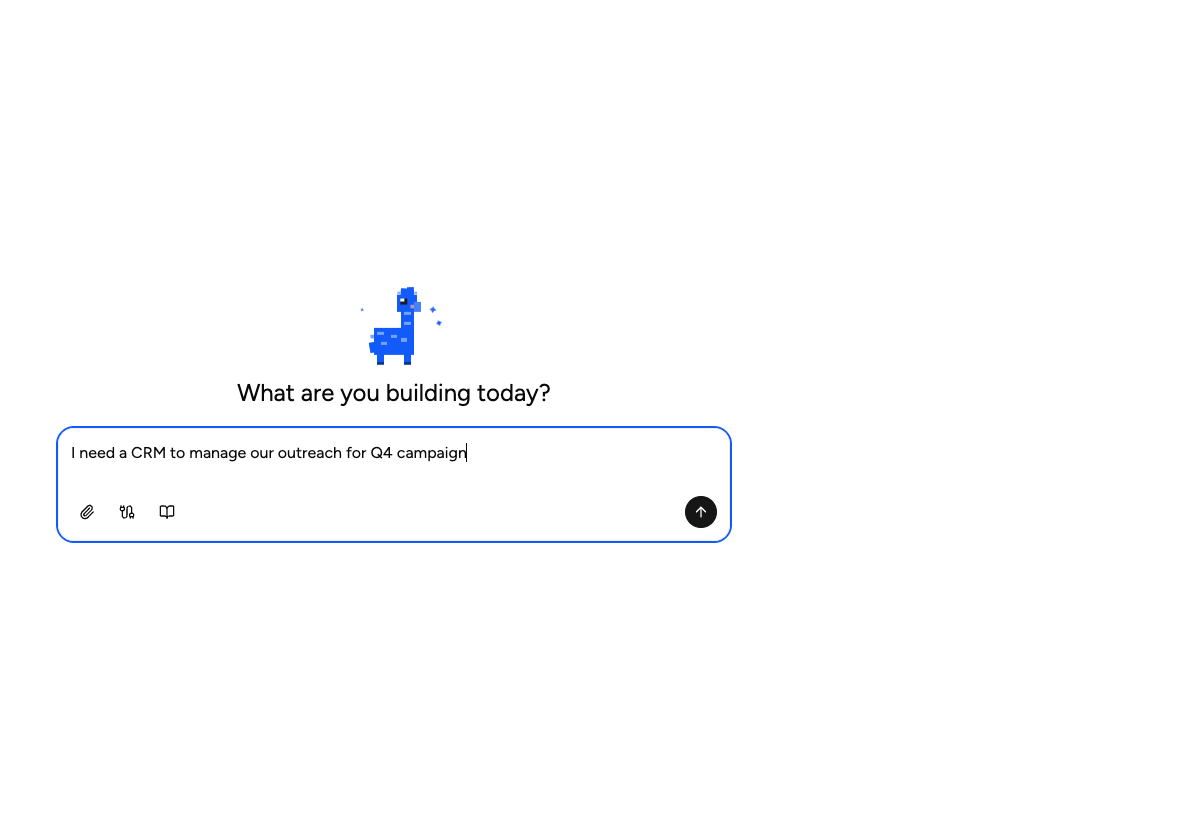
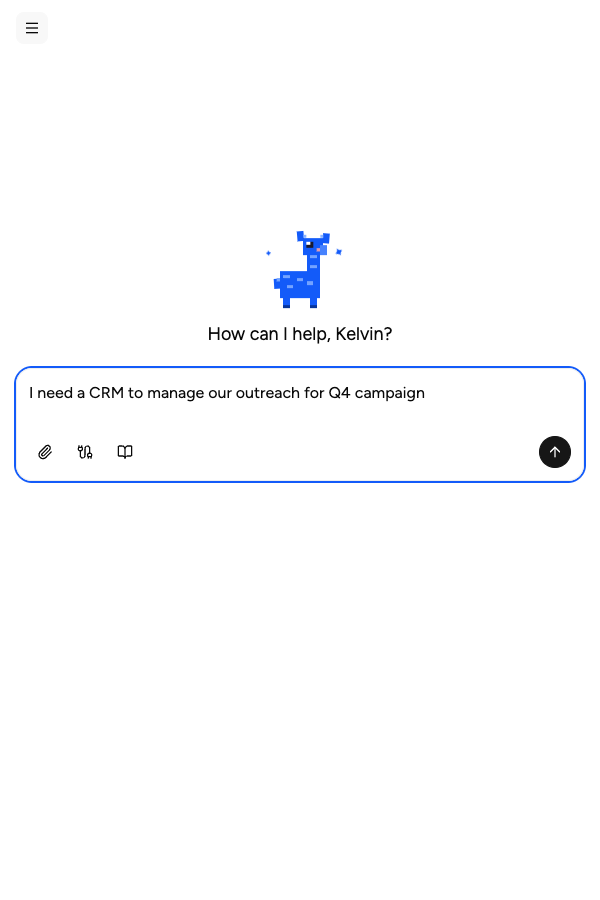
Build a custom internal dashboard with AI
Stop exporting data to spreadsheets to make a chart. Appaca builds a live internal dashboard around your data, connected to the tools your team already uses, without a data team.
The problem with how most teams get their data
Most operational data sits in tools that were not designed to surface it in the right way at the right time.
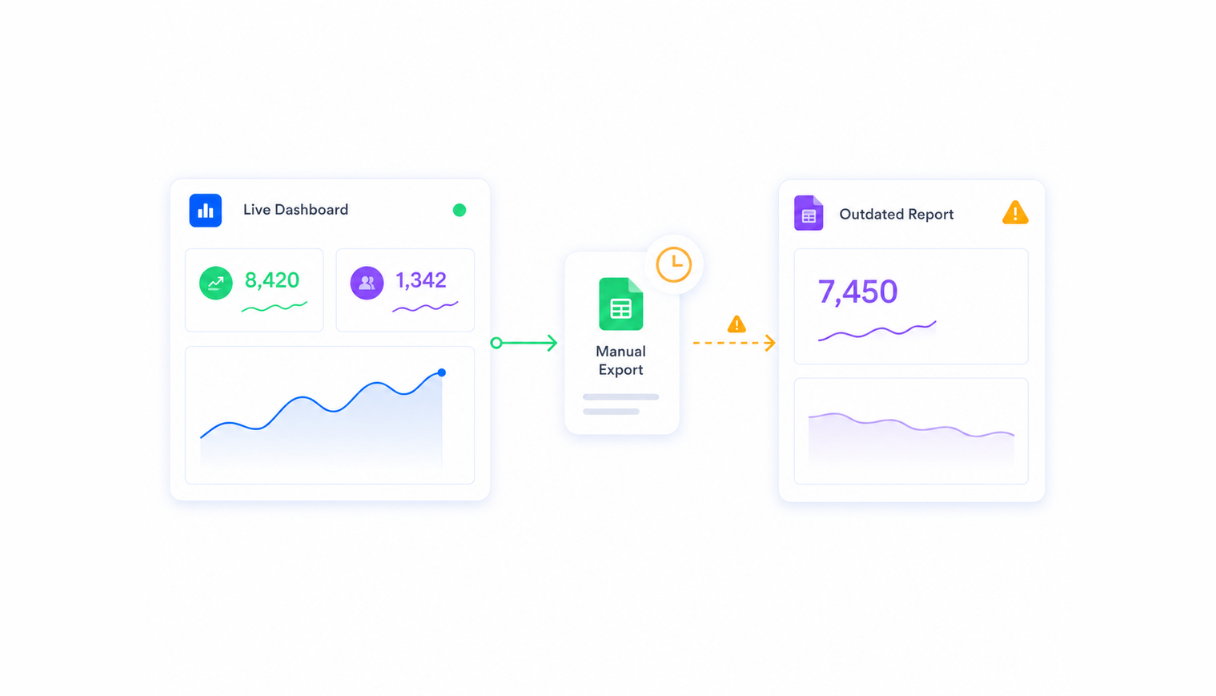
Reports that are always out of date
The number on the dashboard is from last Tuesday because someone ran the export manually and forgot to update the shared doc. By the time you act on it, the data has moved on.
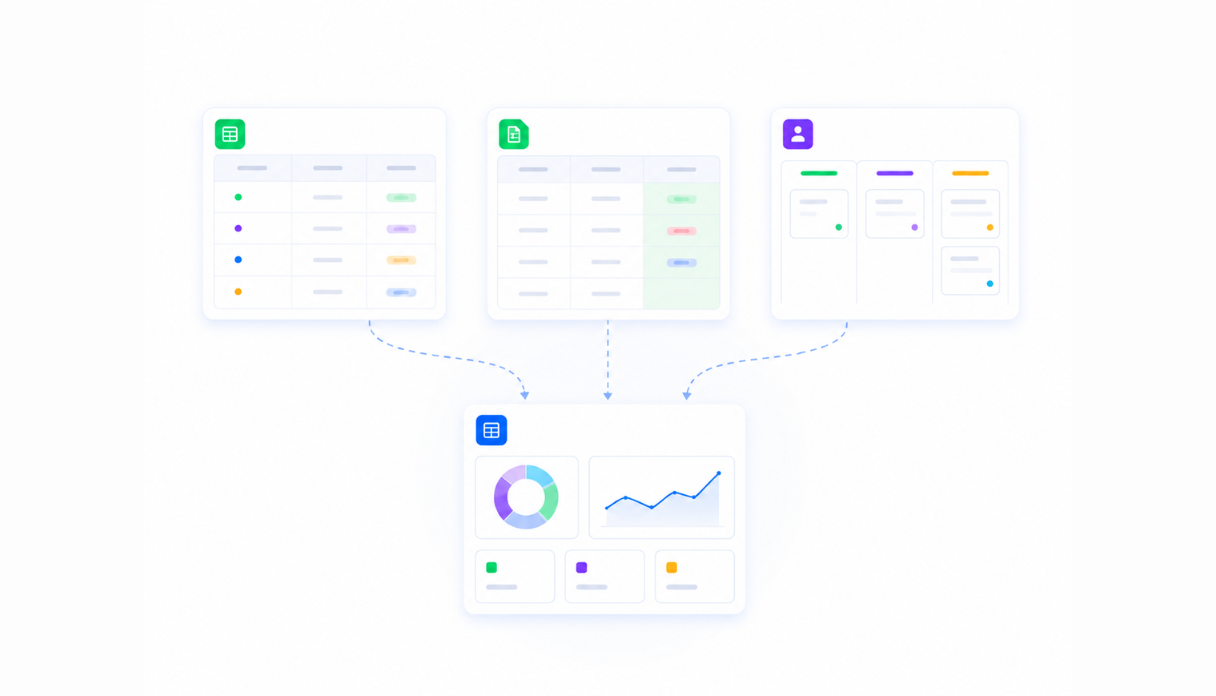
Metrics scattered across too many tools
Your ops data is in Airtable, your finance data is in a spreadsheet, and your pipeline is in the CRM. Getting a single view of your business means opening four tabs and reconciling them yourself.
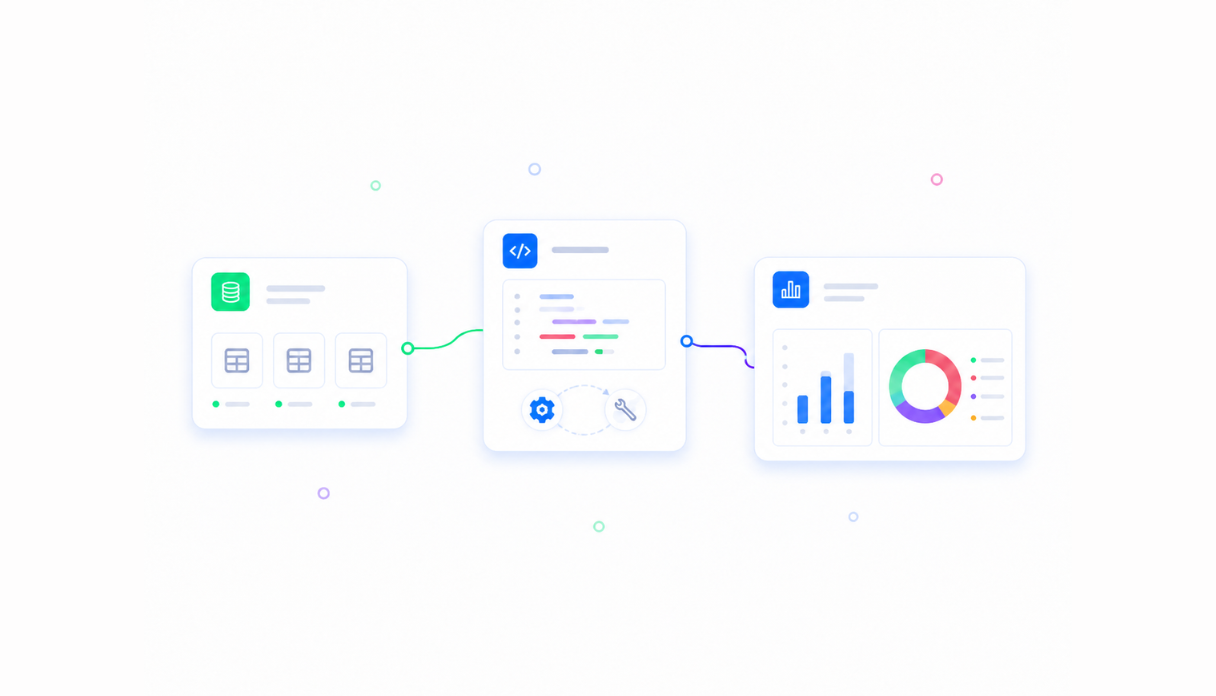
BI tools that need a data engineer
Metabase and Tableau are powerful, but spinning them up requires a data pipeline, SQL queries, and someone who can maintain the whole setup when something changes.
A dashboard built around your data, not a template
Appaca builds your dashboard, connects your data sources, and keeps everything live without requiring a BI specialist or a data pipeline.
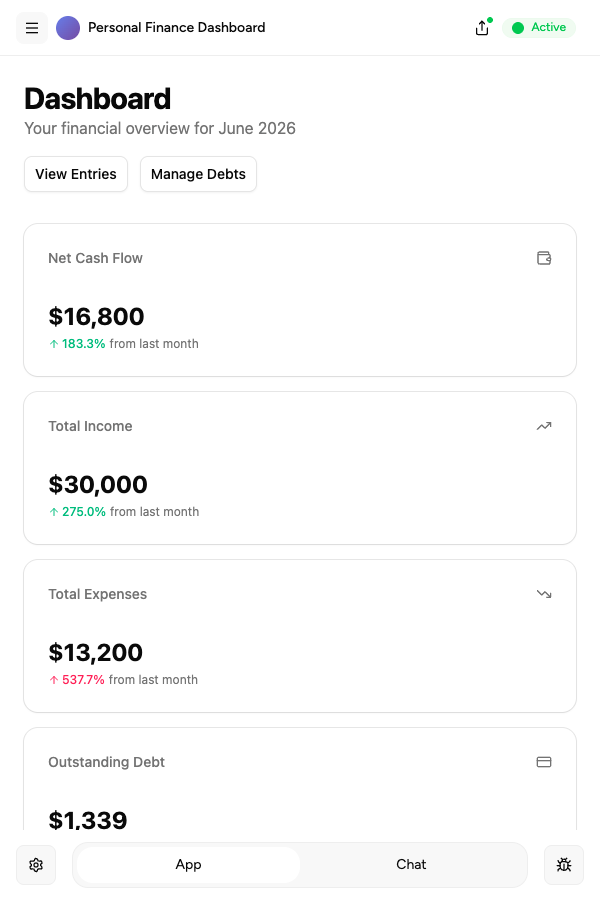
A dashboard built around your metrics
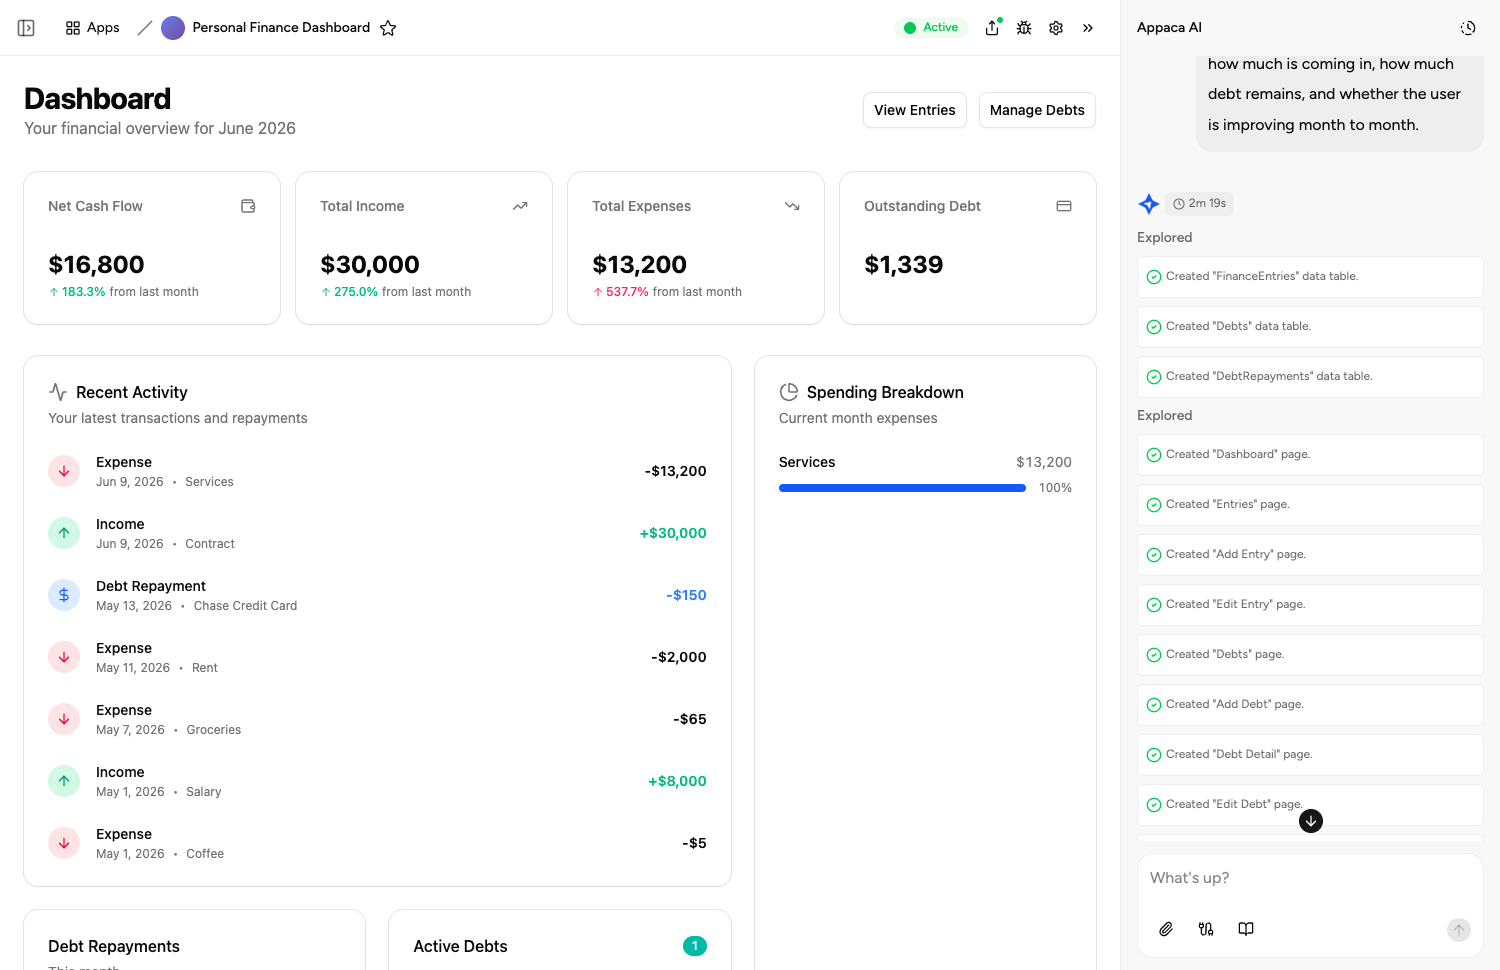
Describe the data you want to see and how you want to see it. The Appaca agent builds a working dashboard with the right charts, tables, and filters for your team. No SQL, no code.
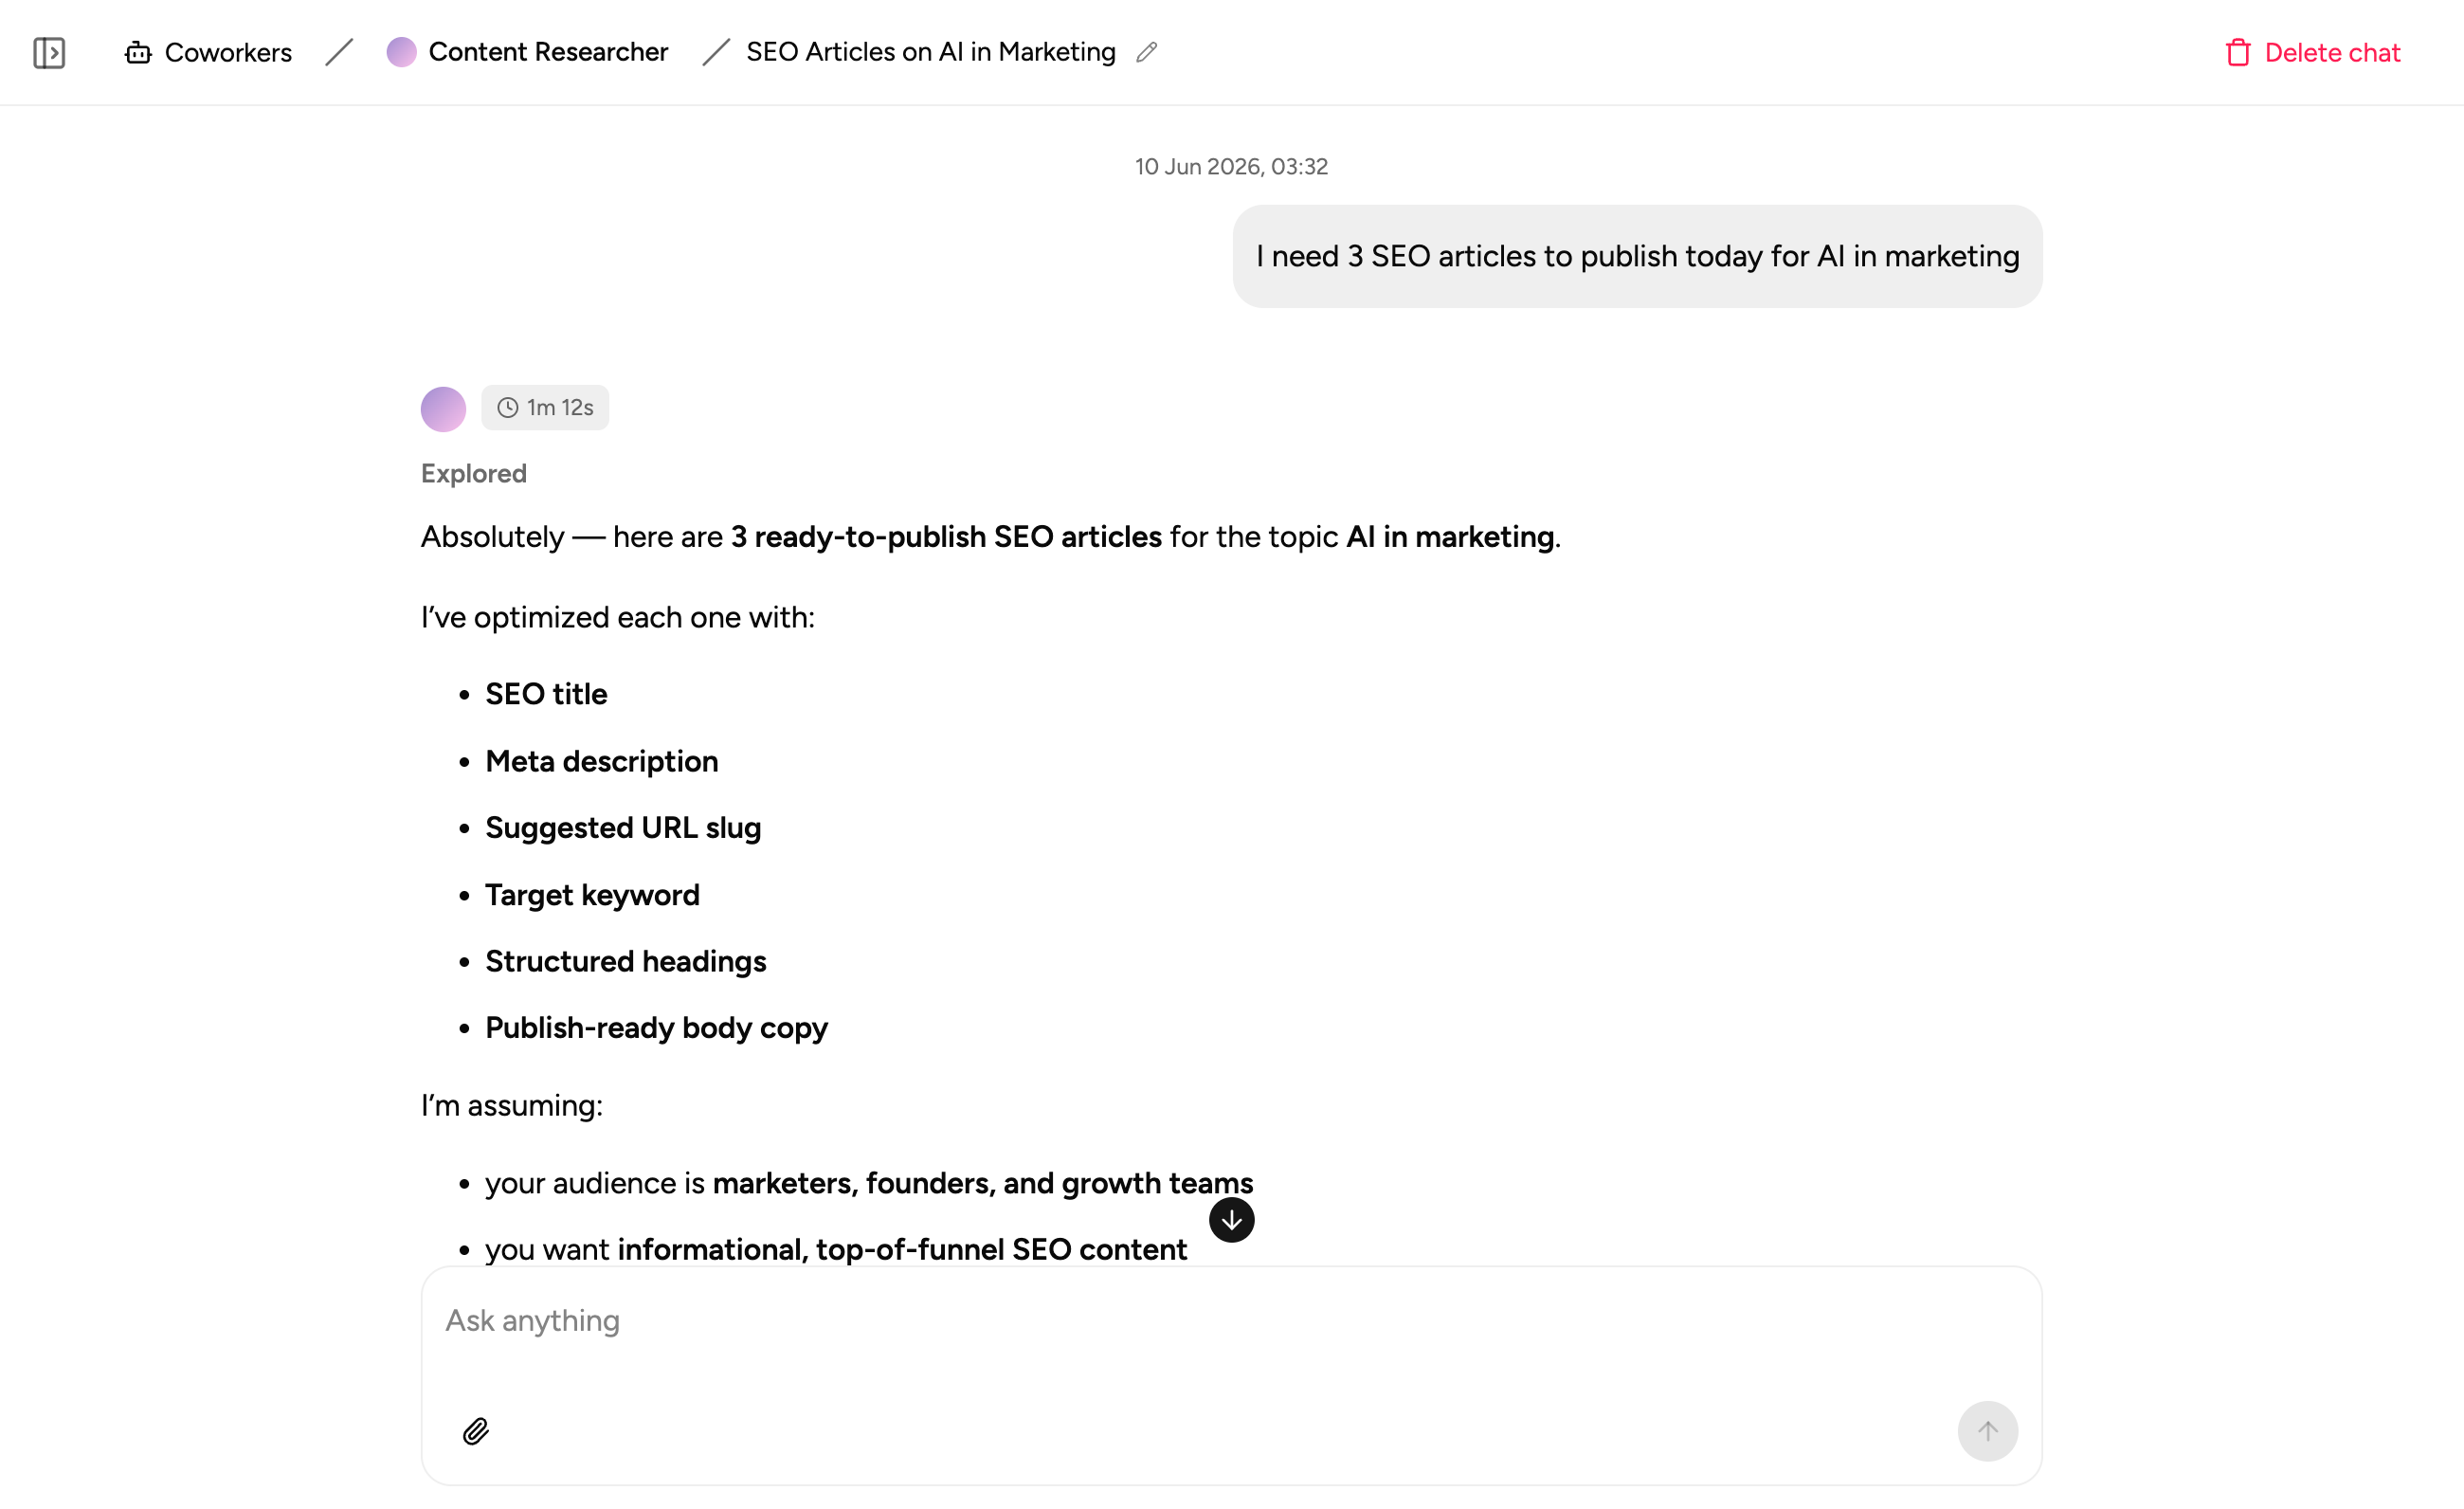
AI that interprets your numbers
Add AI agents that summarise trends, flag anomalies, and generate commentary on your key metrics automatically so your team gets context alongside the data, not just the numbers.
Metric definitions alongside your dashboard
Store your reporting definitions, methodology notes, and data dictionaries in the same workspace. Everyone on the team knows exactly what each number means.
Dashboards teams build with Appaca
From finance reporting to ops performance to sales pipeline views. Appaca builds the dashboards your team actually needs, connected to the data they depend on.
Monthly Finance Report
Turn your finance data into a live dashboard. AI summarises the numbers, flags variances, and formats the report automatically so your team reviews insights, not rows.
Get started free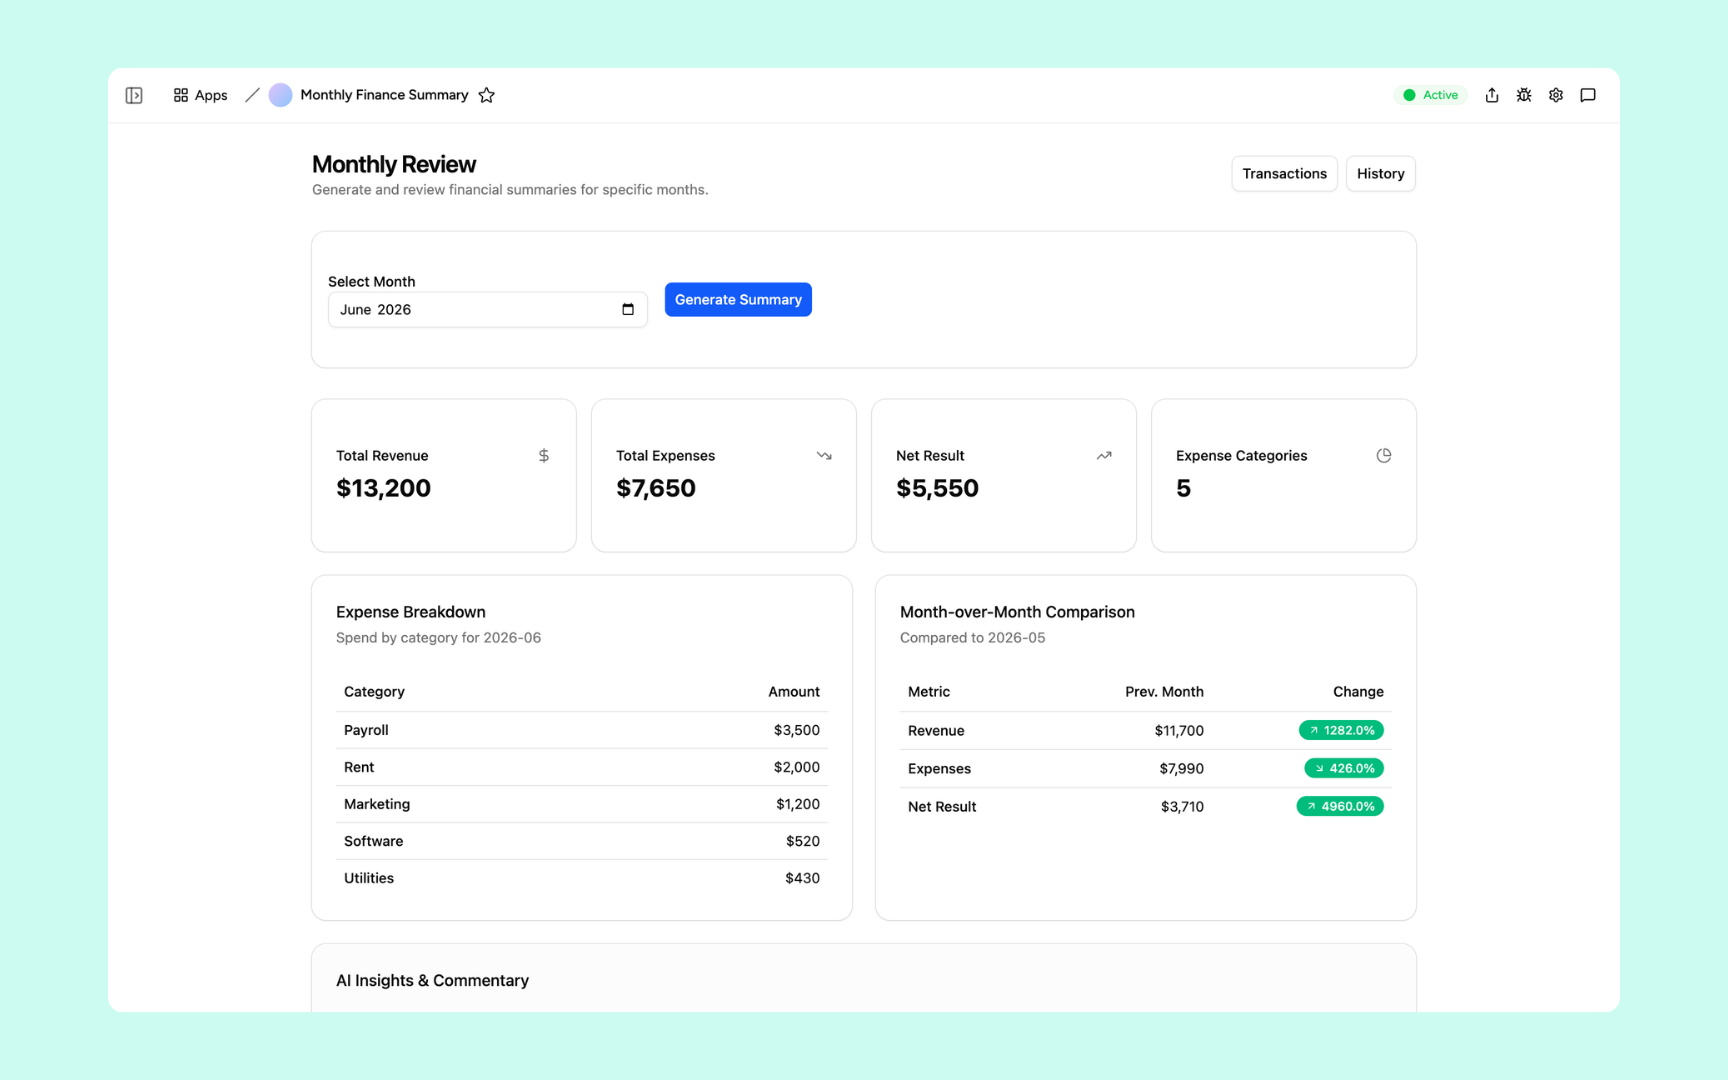
Ops Report Generator
Build a live operations dashboard that pulls data from your tools and generates a structured report on cadence. Your ops team always has the current view without a manual pull.
Get started free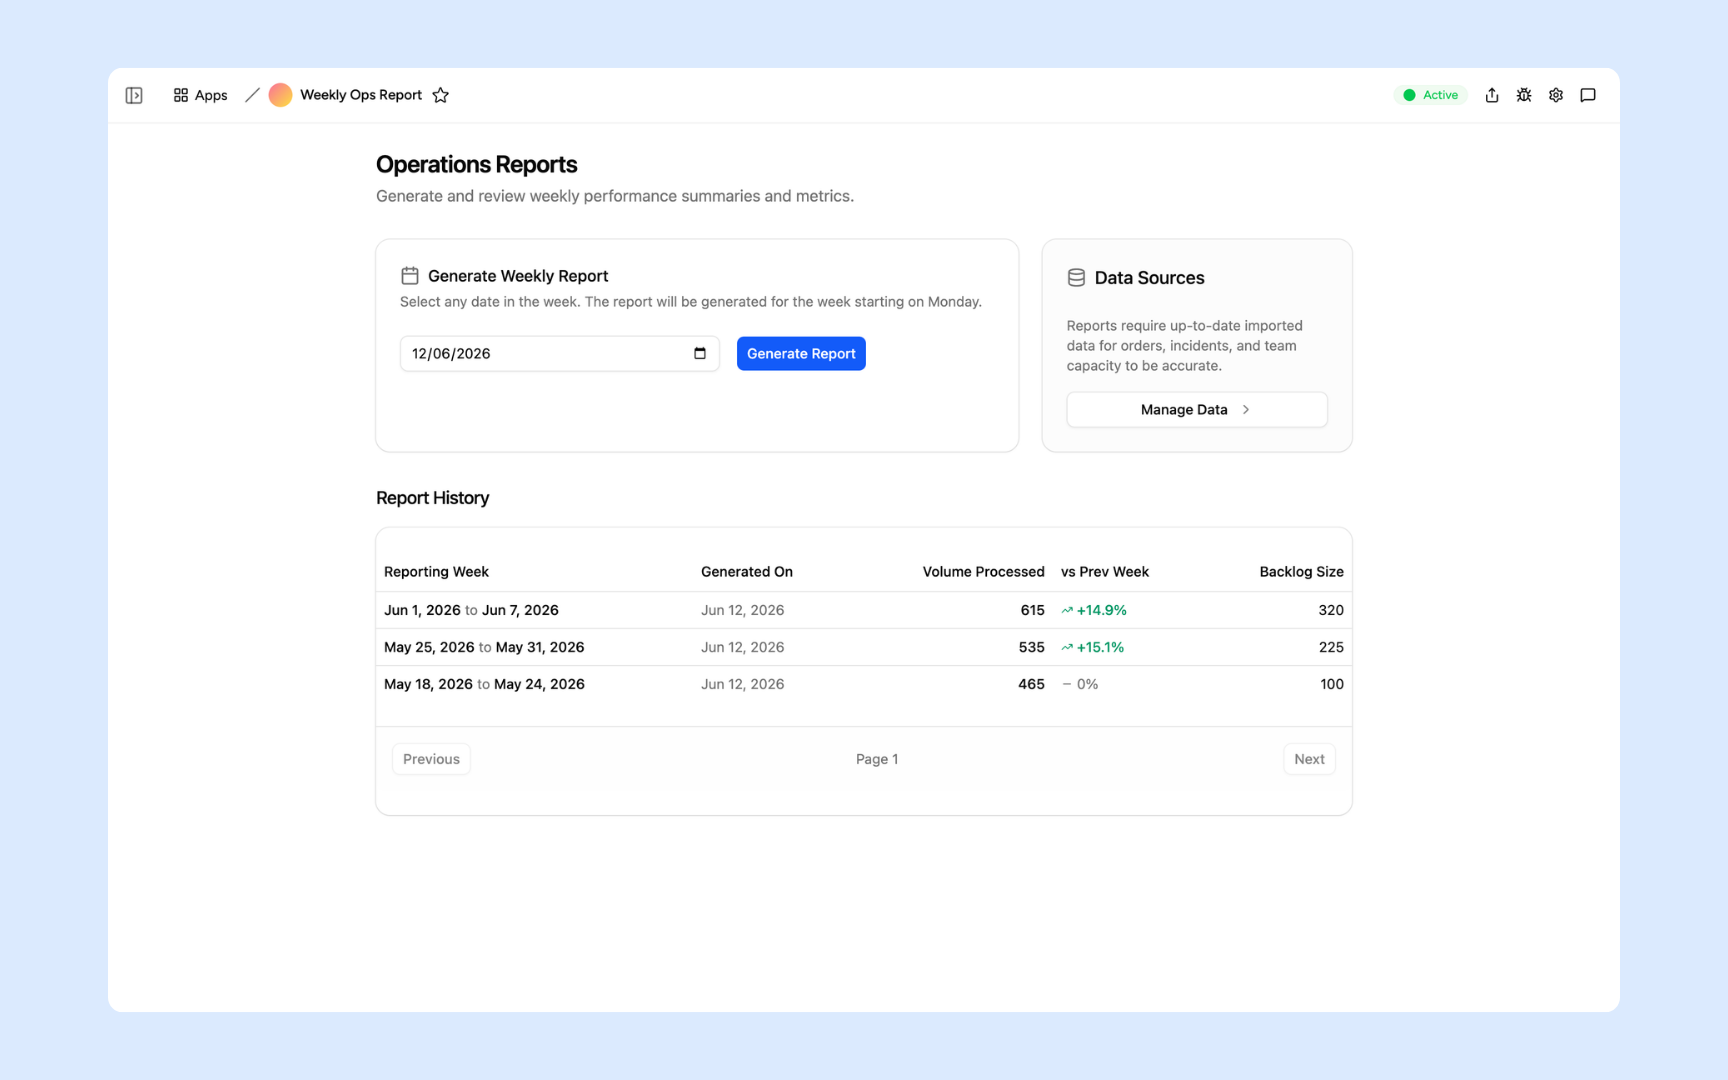
Performance Digest
A real-time performance dashboard built around the metrics that matter to your team. AI highlights what moved, what is lagging, and what needs attention.
Get started free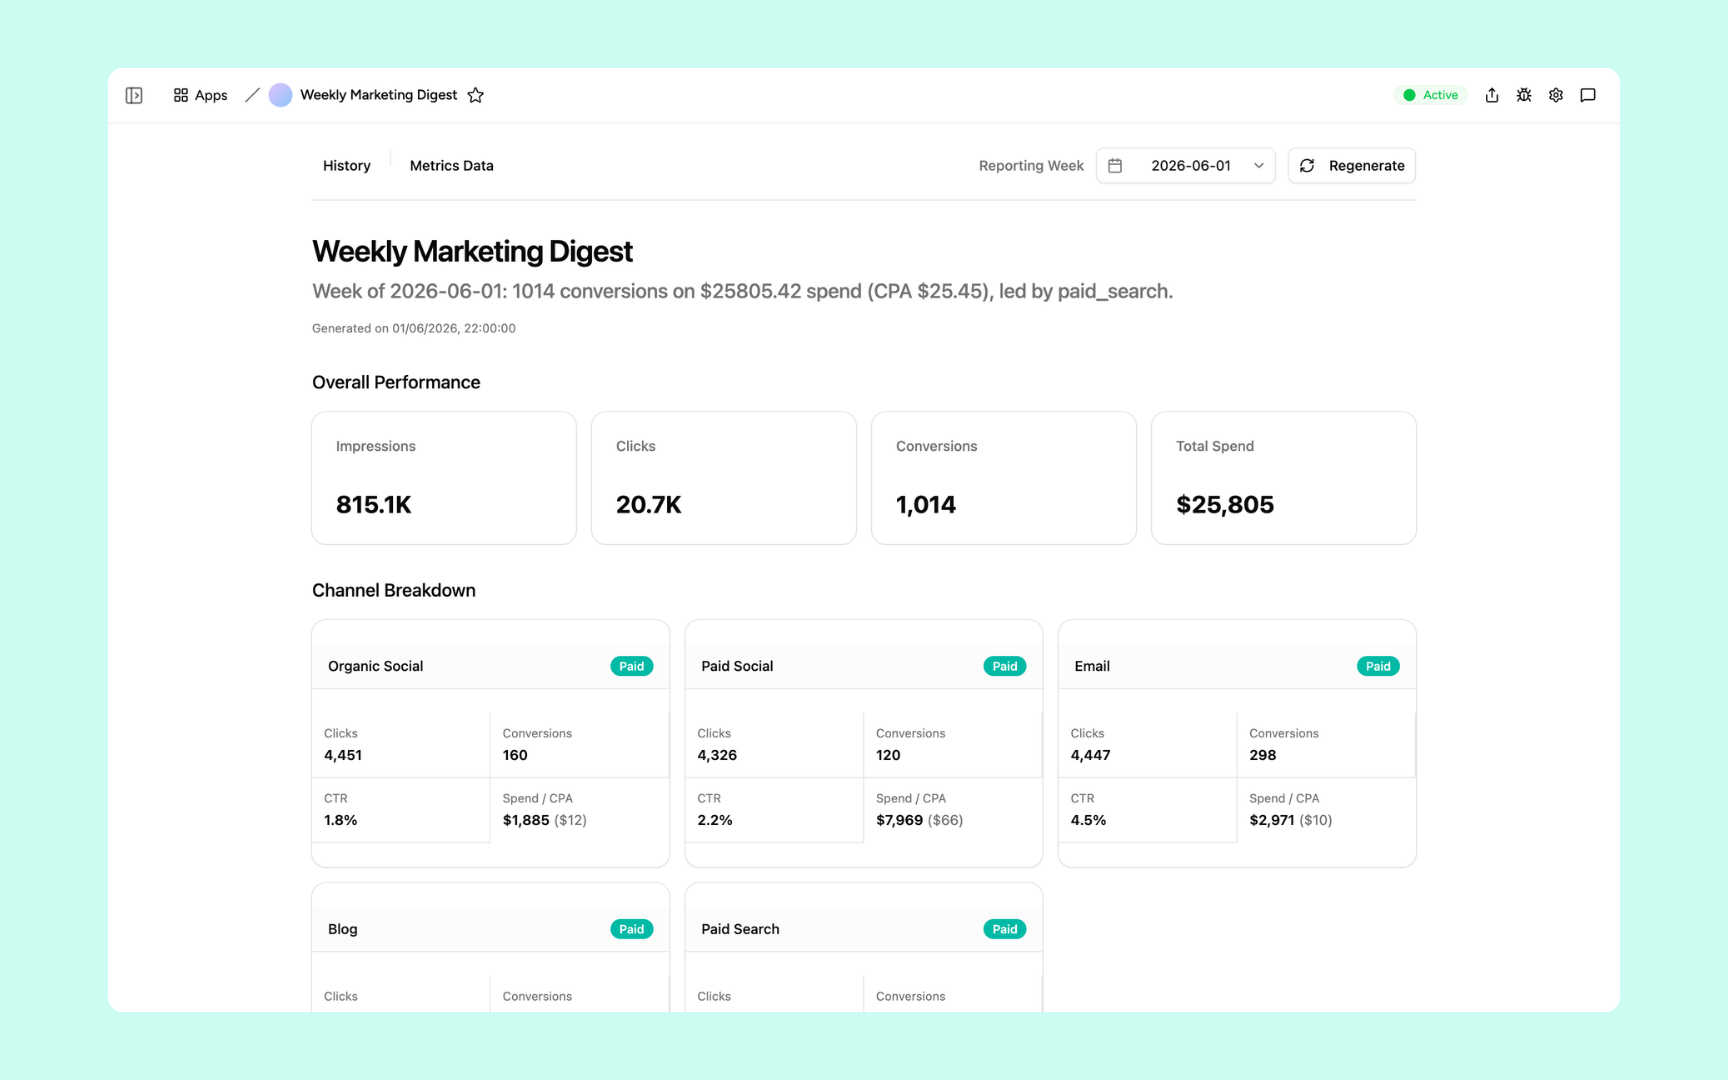
Every dashboard built on a platform your team can trust
Authentication, data storage, automations, and security are all built in. Your dashboard connects to your data sources and your team accesses it from anywhere.
Secure team sign-in
Every team member signs in with their own account. Your dashboard data is only ever seen by the people you invite.
Role-based permissions
Control who can view or edit each dashboard. Give your team the view they need and keep sensitive data where it belongs.
Scheduler and automations
Refresh dashboards on schedule, alert your team when a metric crosses a threshold, and send summary reports to Slack automatically.
Secure built-in database
Store your operational data in a secure built-in database alongside your dashboard. Structured, searchable, and always up to date.
Enterprise-grade security
Your operational data is encrypted, protected, and under your control. No sensitive numbers in a shared spreadsheet anyone can forward.
Access from anywhere
Your dashboard lives in the browser. Your team can check it from the office, home, or on the road without installs or shared drives.
File and image storage
Attach reports, exports, and reference files to the workspace so your team always has the context behind the numbers.
Usage tracking
See which dashboards your team actually looks at and how often so you know what is driving decisions and where to build next.
FAQs
An internal dashboard is a live view of the data your team needs to make decisions. Unlike a report exported from a spreadsheet, an internal dashboard updates automatically, shows the right data to the right people, and lives somewhere your team can check at any time.
No. You describe the metrics and data sources you want and the Appaca agent builds the dashboard for you. No SQL, no data pipeline, no BI team required.
Appaca connects to Google Sheets, Airtable, Notion, Slack, and any service that has an API or webhook. If your data lives in a tool that can send or receive requests, it can feed your dashboard.
Metabase and Tableau are powerful but require technical setup and a dedicated data layer. Appaca builds the dashboard you describe in plain language and connects it to your existing data sources without infrastructure work. It is for teams that need the dashboard working today.
Yes. Every Appaca workspace supports team access with role-based permissions. You decide who can view, edit, or manage each dashboard, and your team accesses it from any browser.
You control the refresh schedule. Dashboards can update on a schedule, when data changes, or in real time depending on how your data sources work. Set it once and it runs automatically.
A dashboard built around your data, not a template
Build a live internal dashboard connected to the tools your team already uses. No code, no data team, no waiting.